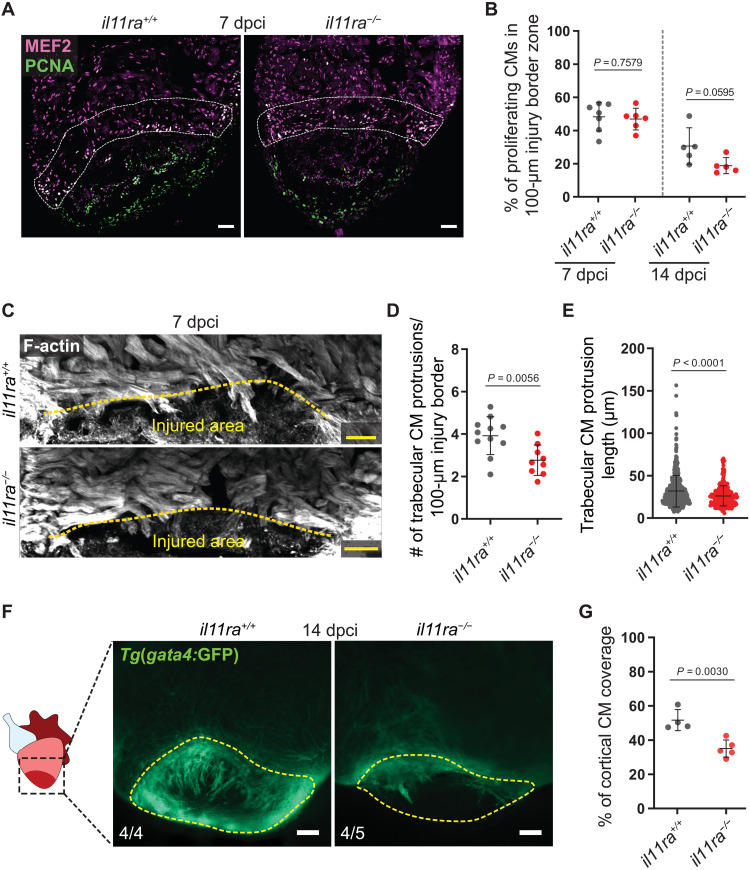
Fig. 4. Il-11 signaling is required for CM repopulation after cardiac injury.
(A and B) Costaining for MEF2 (magenta) and PCNA (green) expression to determine CM mitotic index on cryosections from ventricles (A) (wt siblings, n = 7; mut, n = 6; 7 dpci) and quantification within the 100-μm wound border zone for 7 and 14 dpci (B). (C to E) F-actin staining on 50-μm-thick cryosections from il11ra−/− versus wild-type ventricles, 7 dpci (C), and quantification of the number per ventricle (D) (wt siblings, n = 11; mut, n = 9) and length (E) (wt, n = 540; mut, n = 281) of CM protrusions. (F and G) Wholemount fluorescence images of Tg(gata4:EGFP) expression in ventricles (F) (wt siblings, n = 4; mut, n = 5; 14 dpci) and quantification of cortical CM wound coverage on the corresponding cryosections in fig. S8F (G). Data represent means ± SD (B, D, E, and G). Student’s t tests (B, D, and G); Mann-Whitney U test (E). n, ventricles (A, D, and F); n, CM protrusions (E). White dashed lines demarcate 100-μm injury border zone (A); yellow dashed lines demarcate the injured area (C and F). Scale bars, 50 μm (A and C) and 100 μm (F).

