
|
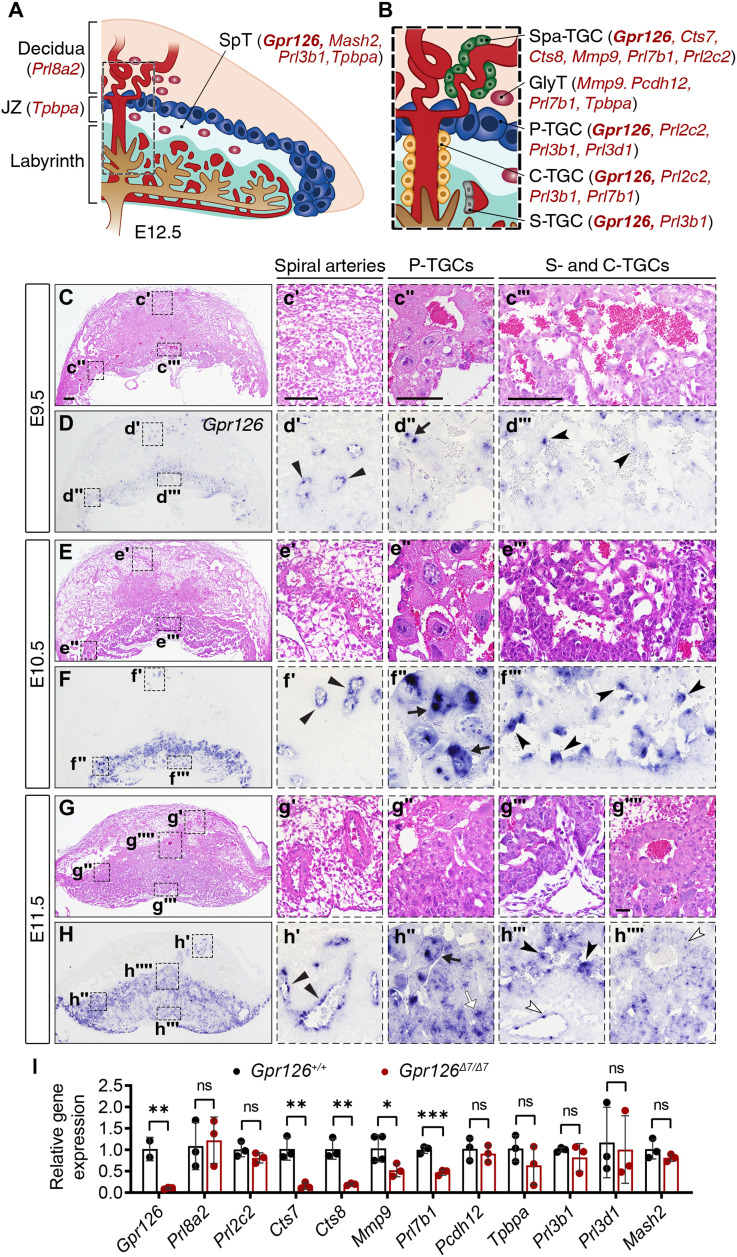
Fig. 4.
(A and B) Cartoon illustrating the main tissue layers (A) and cell types (B) of a WT E12.5 mouse placenta and key marker genes that are expressed in each cell type. Note that family members of the trophoblast giant cell?expressed Prl (prolactin/placental lactogen/prolactin-like protein) genes are also known as follows: Prl3d1 = Pl1, Prl3b1 = Pl2, Prl2c2 = Plf, Prl8a2 = Dtprp, Prl7b1 = PlpN. (C to H?) H&E staining (C to C?, E to E?, and G to G?) and ISH analysis (D to D?, F to F?, and H to H?) of Gpr126 on sagittal sections of E9.5, E10.5, and E11.5 WT placentas. Right panels (?, ?, ?, and ?): High-magnification views of the boxed areas, showing the spiral artery-associated trophoblast giant cells (Spa-TGCs) (?, with gene expression marked with black triangular arrowheads), parietal TGCs (P-TGCs) (?, with gene expression marked with black arrows, except for the white arrow in h?? that points to the SpT), sinusoidal TGCs (S-TGCs) (?, with gene expression marked with black notched arrowheads), and canal TGCs (C-TGCs) (?, with gene expression marked with white notched arrowheads). Scale bars, 200 ?m (low magnification); 50 ?m (insets). (I) qRT-PCR showing relative gene expression of key markers shown in (A and B) in E11.5 Gpr126+/+ and Gpr126?7/?7 placentas. ?-Actin was used as a housekeeping gene. Data are means ▒ SD (n = 3 WT and 3 mutant placentas and 4 WT and 4 mutant placentas for Mmp9 expression analysis). Statistical significance was determined by unpaired Student?s t test (*P < 0.05; **P < 0.01; ***P < 0.001). GlyT, Glycogen trophoblast cell; JZ, junctional zone; SpT, spongiotrophoblast.