Figure 4
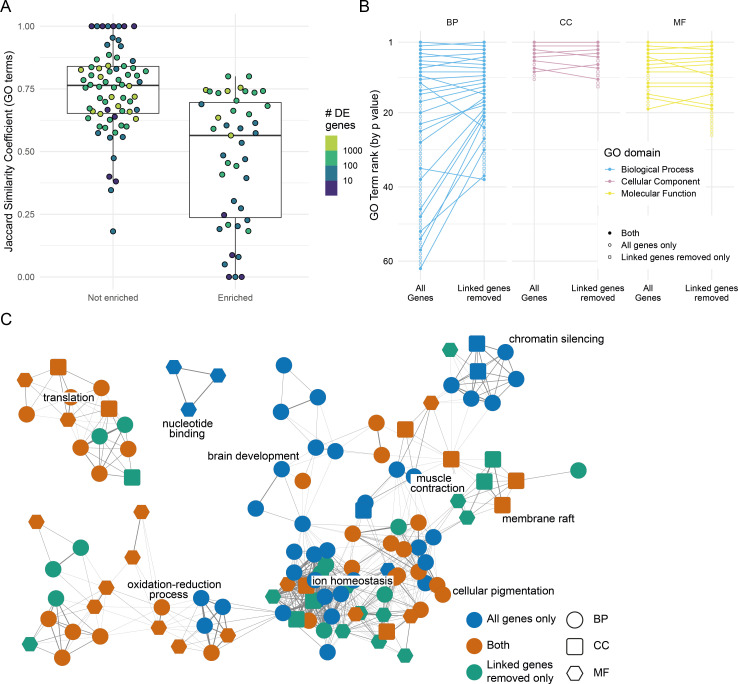
(A) Distribution of the overlap between the Gene Ontology (GO) terms enriched when DE genes linked to the mutation are removed. GO term enrichment was done on both the DE gene list and the list with the genes on the same chromosome as the mutation removed (excluding the mutated gene itself). The lists of enriched GO terms were then compared and the Jaccard similarity coefficient (number of GO terms enriched in both sets/total number of enriched GO terms) calculated. Each point represents one experiment. Experiments are split according to whether the chromosome with the mutated gene has an enrichment of DE genes or not. Points are coloured by the number of DE genes identified in the experiment (log10 scale). (B) Plot showing the changes in GO term enrichment for a single experiment (sox10t3/baz1 incross at 36 hr post-fertilisation). Each point is an enriched GO term ranked by p-value (highest ranked terms at the top) and the lines connect the same terms if they are enriched using both gene lists (all genes or genes linked to the mutation removed). Unconnected points are terms that are only enriched for either the ?all genes? list (open circles) or for the ?linked genes removed list? (open squares). (C) Network diagram representation of the same GO enrichments as in (B). Each node represents a GO term, and the nodes are connected by an edge if the genes annotated to the term overlap sufficiently (Cohen?s kappa > 0.4). GO term nodes are coloured by whether they are enriched in both lists (orange) or just one (blue = all genes only, green = linked genes removed only). The shape of the nodes represents the GO term domain of the term (circle = biological process, square = cellular component, hexagon = molecular function).
Effect of removing differentially expressed (DE) genes linked to the mutation under investigation.
Image
Figure Caption
Acknowledgments
This image is the copyrighted work of the attributed author or publisher, and
ZFIN has permission only to display this image to its users.
Additional permissions should be obtained from the applicable author or publisher of the image.
Full text @ Elife

