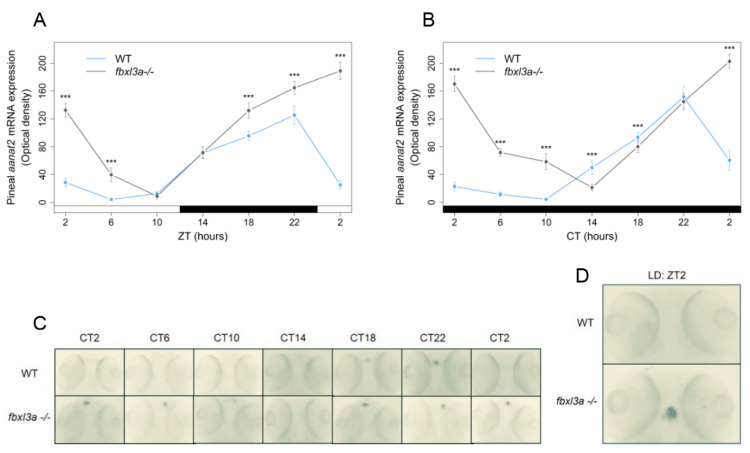
Figure 6
Clock-controlled aanat2 expression in the zebrafish pineal gland is affected by FBXL3a. Fbxl3a mutant larvae exhibit abnormal pineal aanat2 mRNA expression under constant dark (DD) and LD photoperiodic regimes (*** p < 0.001, t-test). Each value represents the mean optical density of pineal aanat2 expression using whole mount in situ hybridization (ISH) quantification (n = 15–20). ZT (hours) is indicated for each sample; white and black bars represent light and dark, respectively. Pineal aanat2 ISH quantification of 72–96 h post-fertilization (hpf) fbxl3a−/− larvae and their WT siblings under LD (A) or DD (B) conditions, after entrainment by three LD cycles. (C) Representative pineal aanat2 ISH signal of 72–96 hpf fbxl3a−/− larvae (bottom panel) and their WT siblings (top panel) under DD conditions. (D) Pineal aanat2 signal of a 96 hpf fbxl3a−/− larva and its WT sibling after four LD cycles (at ZT2).

