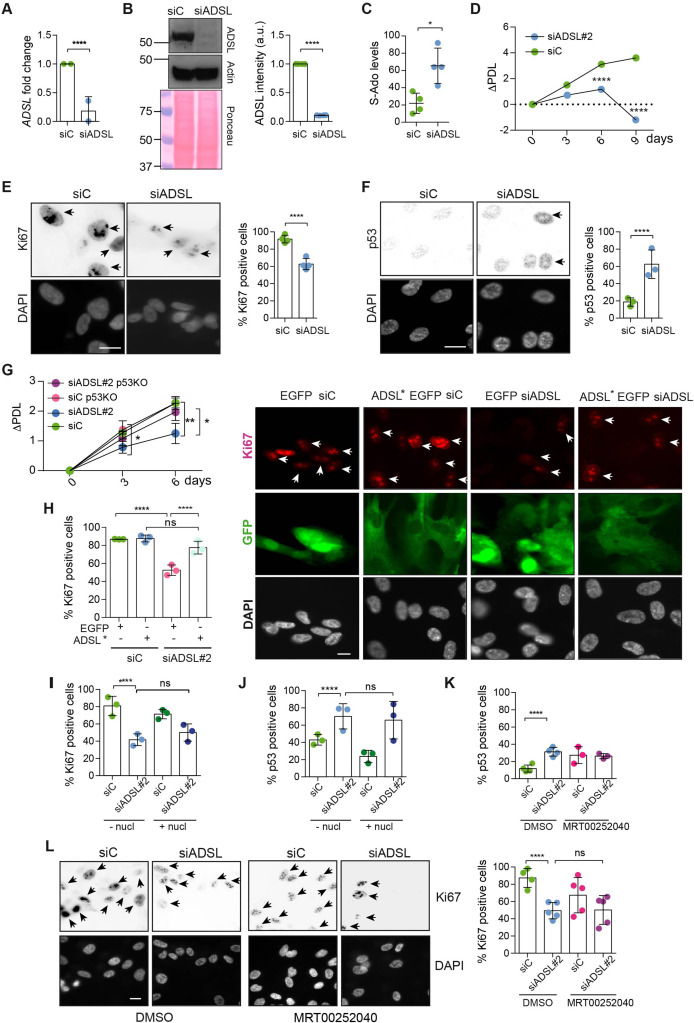
Figure 1
(A) Reduced mRNA levels of ADSL confirmed by qRT-PCR experiments. hTERT-RPE-1 were silenced with smart pool RNAi for 96 hr before harvesting. Two independent experiments in triplicate are shown in the panel (n = 2, two-tailed t-test, ****p<0.0001) (B) Western blot of RPE-1 cell extracts treated as in (A). One experiment is shown as representative of four independent experiments. Actin was used as a loading control. Quantifications of ADSL intensity in four different experiments were performed by ImageJ software and normalized to actin first and then to the relative controls (n = 4, two-tailed t-test, ****p<0.0001). Ponceau is shown as an additional loading and transfer control. (C) S-Ado levels in RPE-1 cells silenced with a single control or ADSL siRNA (n = 4, two-tailed t-test, *p<0.05). (D) Cell proliferation rates of RPE-1 cells quantified every 3 days after treatment with a single control or ADSL siRNA in medium with serum (n = 3, two-tailed t-test ****p<0.0001). ?PDL represent the difference in population doubling levels quantified through the formula described in Materials and methods. (E) Ki67-positive cells (indicated by arrows) upon 96 hr of silencing with control or ADSL smart pool siRNAs. Scale bar 10 ?m (n = 4, scored 767 cells for siC, 694 cells for siADSL conditions, ****p<0.0001). (F) The percentage of p53-positive cells (indicated by arrows) following treatment with control or ADSL smart pool siRNAs was quantified in three independent experiments (n = 3, scored 835 cells for siC and 1126 cells for siADSL, *p<0.05). (G) Cell proliferation rates in RPE-1 wt and p53 knockout KO cells as in (D) were counted for 6 days (n = 3, two-tailed t-test, **p<0.01, *p<0.05). (H) RPE-1 cells stably expressing EGFP or ADSL*-EGFP were transfected with a single control or ADSL siRNAs for 96 hr and immunostained with anti-Ki67 antibody. Scale bar = 20 ?m. Quantification of Ki67-positive cells (n = 3, scored 278 cells for EGFP siC, 264 for EGFP siADSL, 266 for ADSL* siC, 232 cells for ADSL* siADSL conditions, ns not significant, ****p<0.0001). (I) Quantification of RPE-1 transfected with a single control or ADSL siRNA for 96 hr in the presence or absence of 60 ?M nucleosides. Cells were fixed and immunostained with anti-Ki67 antibody (n = 3, at least 100 cells per conditions were counted in each experiment, ns not significant, ****p<0.0001). (J) Quantification of RPE-1 in the same conditions of (I) and immunostained with anti-p53 antibody (n = 3, at least 100 cells were counted for each condition per experiment, ns not significant, ****p<0.0001). (K) Quantification of p53-positive cells in ADSL-depleted cells in the presence or absence of the phosphoribosylaminoimidazole carboxylase (PAICS) inhibitor MRT00252040 (n = 3, scored 223 cells for siC, 248 cells for siADSL, 336 cells for siC+ MRT00252040, 365 cells for siADSL + MRT00252040, ns not significant, ****p<0.001, *p<0.05). (L) Quantification of Ki67-positive cells in ADSL-depleted cells in the presence or absence of MRT00252040 (n = 5, more than 60 cells were counted in each condition for each experiment, ns not significant, ***p<0.001). Positive cells are indicated with arrows in siADSL panels. All graphs depict means ± SD with individual values shown in circles.
Adenylosuccinate lyase (ADSL) depletion causes p53-dependent proliferation defects.
Image
Figure Caption
Acknowledgments
This image is the copyrighted work of the attributed author or publisher, and
ZFIN has permission only to display this image to its users.
Additional permissions should be obtained from the applicable author or publisher of the image.
Full text @ Elife

