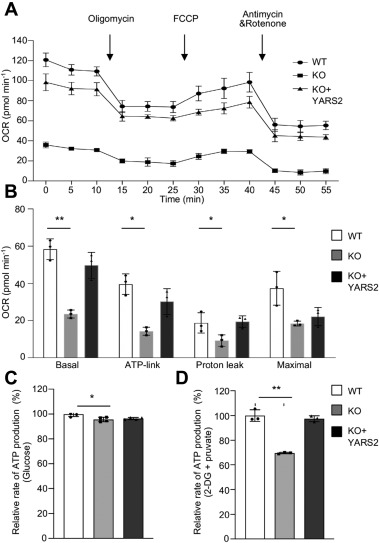
Fig. 4 Deficient oxidative phosphorylation. A, an analysis of O2 consumption in the various cell lines using different inhibitors. The rates of O2 (OCR) were first measured on 2 × 10⁴ cells of each cell line under basal condition and then sequentially added to oligomycin (1.5 mM), carbonyl cyanide p-(trifluoromethoxy) phenylhydrazone (FCCP) (0.5 mM), rotenone (1.0 mM), and antimycin A (1.0 mM) at indicated times to determine different parameters of mitochondrial functions. B, graphs presented the basal OCR, ATP-linked OCR, proton leak OCR, and maximal OCR in cell lines. Basal OCR was determined as OCR before oligomycin minus OCR after rotenone/antimycin A. ATP-lined OCR was determined as OCR before oligomycin minus OCR after oligomycin. Proton leak was determined as Basal OCR minus ATP-linked OCR. Maximal was determined as the OCR after FCCP minus nonmitochondrial OCR. C and D, measurement of whole-cell and mitochondrial ATP levels using bioluminescence assay. Cells were incubated with 10 mM glucose or 5 mM 2-deoxy-d-glucose plus 5 mM pyruvate to determine ATP generation under mitochondrial ATP synthesis. Average rates of ATP level per cell line and are shown: (C) ATP levels in total cells. D, ATP levels in mitochondria. Three independent experiments were made for each cell line. Graph details and symbols are explained in the legend to Figure 2.
Image
Figure Caption
Acknowledgments
This image is the copyrighted work of the attributed author or publisher, and
ZFIN has permission only to display this image to its users.
Additional permissions should be obtained from the applicable author or publisher of the image.
Full text @ J. Biol. Chem.

