Figure 6
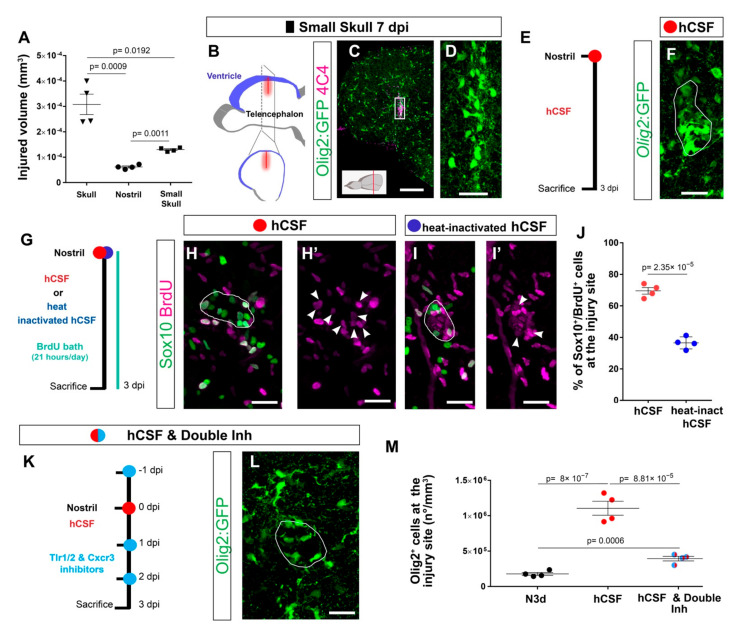
Cerebrospinal fluid-derived molecules induce the proliferation of OPCs and a reactive gliosis-like phenotype. (A) Graph depicting the size of the injured volume after skull, nostril, and small skull injury at 1 dpi. p-values are based on a Welch one-way ANOVA (unequal variances; p-value = 3.034 × 10?4) with a post-hoc Dunnett T3 test with unequal variances (all pairs). (B) Scheme depicting the small skull injury model. Nostril and small skull injuries were performed with a glass capillary. The red line indicates the dorso-ventral injury through the skull and blue indicates the location of the telencephalic ventricle. (C) Image illustrating the reactivity of Olig2:GFP+ and 4C4+ cells 7 days after small skull injury. (D) Magnification of the oligodendroglial accumulation boxed in (C). (E) Design of the experimental workflow to analyze the effect of human CSF administration. (F) Image illustrating the reactivity of Olig2:GFP+ cells 3 days after nostril injury and hCSF treatment. White line depicts the injury site. (G) Experimental design to analyze the proliferative capacity (BrdU incorporation) of Sox10+ cells after nostril injury at 3 dpi and hCSF or heat-inactivated hCSF administration. (H?I?) Images showing the accumulation of Sox10+ and BrdU+ cells at the nostril injury site after hCSF (H,H?) or heat-inactivated human CSF (I,I?) administration. White lines depict the injury site and white arrowheads the colocalization of BrdU and Sox10. (J) Dot-plot depicting the proportion of Sox10+ and BrdU+ cells accumulating at the nostril injury site after hCSF or heat-inactivated hCSF administration. p-value is based on Student?s t-test with equal variances. (K) Workflow to study the effect of the Tlr1/2 and Cxcr3 inhibitor treatment after human CSF injection. (L) Micrograph of a nostril-injured telencephalon at 3 dpi depicting Olig2:GFP+ cell reactivity following human CSF and inhibitor treatment. The white line depicts the injury site. (M) Graph showing the density of Olig2:GFP+ cells at the injury site at 3 dpi after nostril injury, treatment hCSF, and treatment with hCSF and double-inhibitor. p-values are based on one-way ANOVA (p-value = 1.042 × 10?6) with post-hoc Tukey Test (all pairs). Data are shown as mean ± SEM; each data point represents one animal. All images are full z-projections of confocal stack. Scale bars in (C) = 100 ?m; scale bars in (D,F,H,H?,I, I?,L) = 20 ?m. Abbreviations: dpi: days post-injury; hCSF: human cerebrospinal fluid; Inh: inhibitors; N3d; nostril 3 dpi. Symbol description: black triangle: skull injury; black circle: nostril injury; black rectangle: small skull injury; red circle: human CSF administration; blue circle: heat-inactivated hCSF treatment; light blue circle: double inhibitors, NBI 74330 and CU CPT22.

