Figure 5
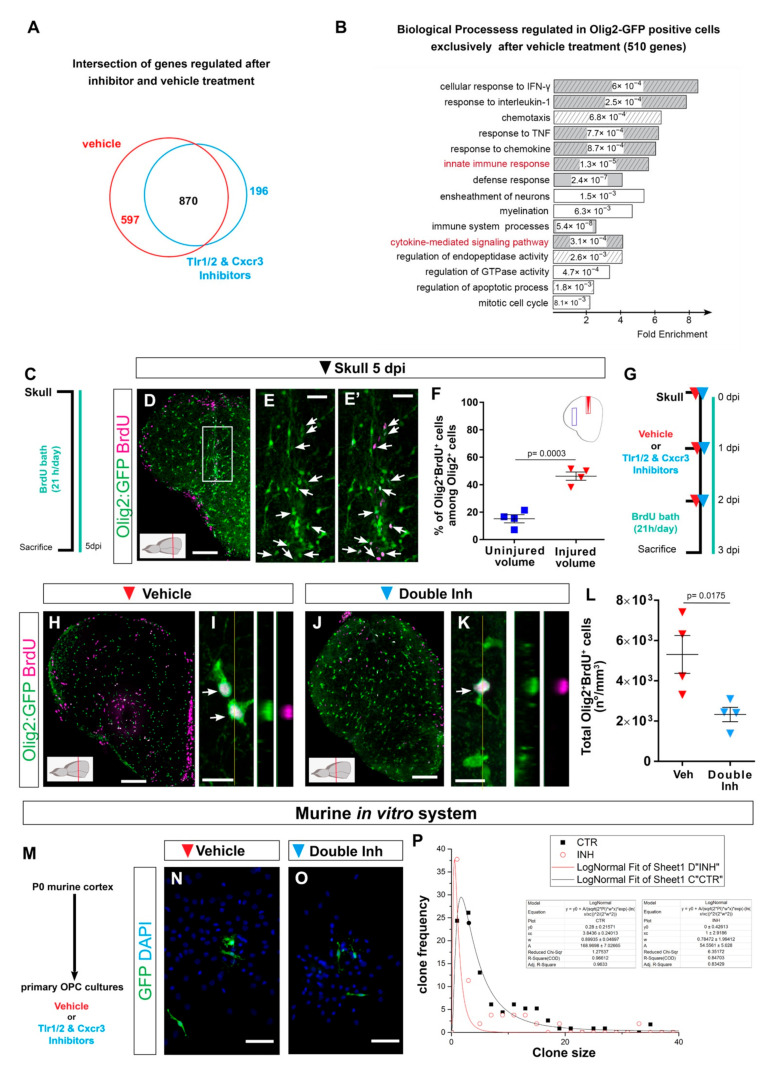
Transcriptome analysis of zebrafish oligodendrocyte lineage reveals the activation of innate immunity and cell cycle pathways after skull injury. (A) Venn diagram of genes regulated at 3 dpi in Olig2-GFP+ cells after vehicle (red) and Tlr1/2 and Cxcr3 inhibitor (cyan) treatment. (B) Histogram depicting GO biological process terms significantly enriched (p-values indicated on bars) in a gene set (597 genes in (A)) normalized after inhibitor treatment and therefore regulated exclusively after vehicle treatment. GO terms related to inflammatory response are shown by gray bars; patterned bars indicate processes previously reported to be activated in response to injury. Note that both innate immunity and cytokine-mediated signaling pathways are normalized upon inhibitor treatment. (C) Scheme depicting the experimental design to analyze the proliferative capacity of Olig2:GFP+ cells during the first 5 days after skull injury. (D) Micrograph of injured section 5 days after skull injury stained for GFP and BrdU. (E,E?) Magnification of the oligodendroglial accumulation boxed in (D). Double Olig2:GFP+ and BrdU+ cells are marked with white arrows. (F) Graph illustrating the proportion of Olig2:GFP+ and BrdU+ cells located at the injury site and in an equivalent uninjured volume in the same section. Note that 45% of the Olig2:GFP+ cells at the injury site proliferated after skull injury. (G) Scheme of the experimental design to assess the proliferation of Olig2-GFP+ cells after vehicle and inhibitors treatment. (H,J) Images of telencephalic sections 3 days after skull injury and BrdU bath with vehicle (H) and double inhibitors (J) treatments. (I,K) Micrographs with orthogonal projections of proliferating (BrdU+) Olig2:GFP+ cells after vehicle (I) and Tlr1/2 and Cxcr3 inhibitor (K) treatment. (L) Graph depicting the density of Olig2:GFP+ and BrdU+ cells 3 dpi in vehicle and Tlr1/2 and Cxcr3 inhibitor treated animals. (M) Experimental design to measure the clonal growth of murine OPCs primary cultures after vehicle and Tlr1/2 and Cxcr3 inhibitor cocktail treatment. OPCs were permanently labeled with GFP expressing retrovirus. (N,O) Micrographs depicting OPC derived clones 5 days after retroviral infection in vehicle (N) and Tlr1/2 and Cxcr3 inhibitor (NBI 74330 and CU CPT22) cocktail (O) treated primary OPCs culture. (P) Graph depicting the frequency of different clone sizes in the vehicle (CTR) and Tlr1/2 and Cxcr3 inhibitor cocktail (INH) treated primary OPCs culture. Data are shown as mean ± SEM; each data point represents one animal. p-values are based on Student?s t-test with equal variances. All images are full z-projections of a confocal stack. The level of the cross-section is indicated in the inset. Scale bars in (D,H,J) = 100 ?m; scale bars in (N,O) = 50?m, scale bars in (E,E?) = 20 ?m; scale bars in (I,K) = 10 ?m. Abbreviations: dpi: days post-injury; Veh: vehicle; Inh: inhibitors; OPC: oligodendrocyte progenitor cell. Symbol description: Triangle: skull injury; blue square: uninjured volume; red triangle: vehicle; light blue triangle: double inhibitors, NBI 74330 and CU CPT22; black square: control primary OPCs; red circle: double inhibitor (NBI 74330 and CU CPT22) treated primary OPCs.

