
|
Fig 3
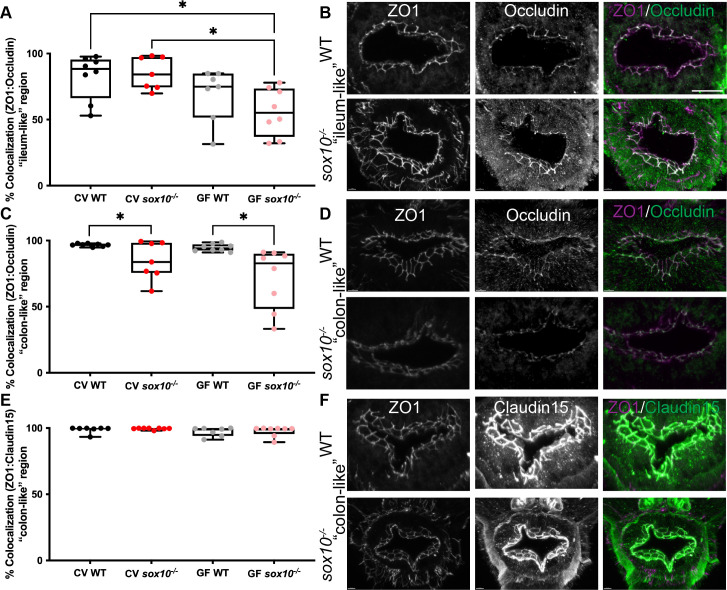
(A) Quantification of percent ZO1 colocalized with Occludin in the “ileum-like” region of CV and GF larvae. (B) Representative immunohistochemistry of CV WT and sox10 mutant ZO1, Occludin and colocalization in “ileum-like” region. (C) Quantification of percent ZO1 colocalized with Occludin in the “colon-like” region of CV and GF larvae. (D) Representative immunohistochemistry of ZO1, Occludin and colocalization in “colon-like” region. (E) Quantification of percent ZO1 colocalized with Claudin-15 in the ‘colon-like” region of CV and GF larvae. (F) Representative immunohistochemistry of ZO1, Claudin-15 and colocalization in “colon-like” region. Scale bar = 20μm. Each point in A, C and E is the average value of 2–3 sections per fish. Staining was performed on larvae from two independent GF derivations (n>7). Boxes represent the first to third quartiles, center bar denotes the median, and whiskers the maximum and minimum of each dataset. * p < 0.05. ANOVA followed by Tukey’s post hoc test.