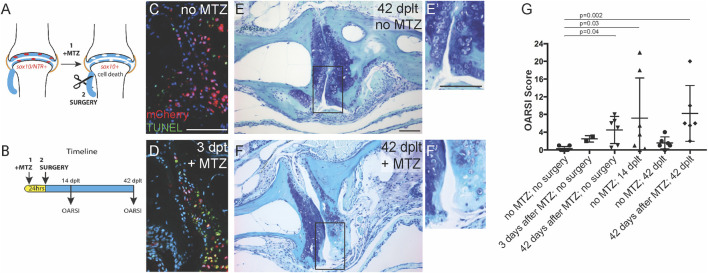
FIGURE 3 Sox10-expressing cells are required for cartilage regeneration. (A) Genetic ablation model. (B) Timeline for treatment and analysis. (C,D) Antibody and TUNEL staining of the adult jaw joint shows mCherry expression in sox10:mCh-NTR adult joint cells and apoptotic cells in metronidazole (Mtz)-treated animals at (D) 3 days after Mtz treatment (days post-ligament transection, dplt). (E,F) Toluidine blue staining of joints at 42 dplt without (E) or with Mtz treatment (F) prior to ligament injury (insets in E? and F? show the details of the articular surface). (G) OARSI scoring of joint integrity following Mtz treatment and/or ligament injury. Individual data points, mean, and standard error of the mean are shown. The p-values are calculated by Kruskal?Wallis ANOVA and Dunn?s multiple-comparison test. Scale bars = 50 ?m.
Image
Figure Caption
Acknowledgments
This image is the copyrighted work of the attributed author or publisher, and
ZFIN has permission only to display this image to its users.
Additional permissions should be obtained from the applicable author or publisher of the image.
Full text @ Front Cell Dev Biol

