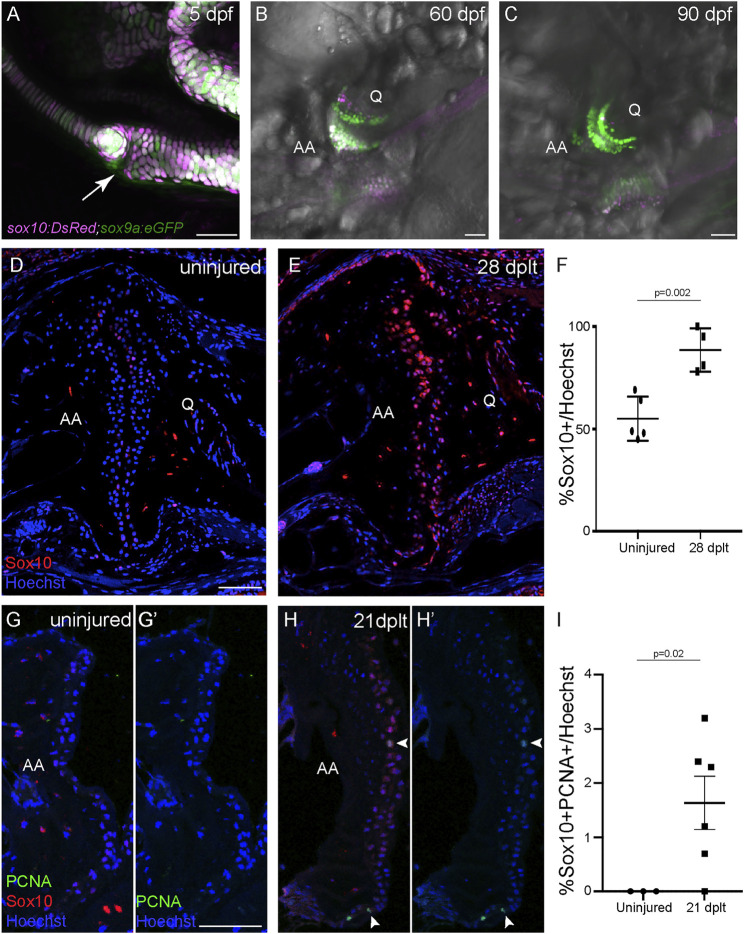
FIGURE 2 Sox10 expression is upregulated during cartilage regeneration. (A?C) sox10:DsRed and sox9a:eGFP are broadly co-expressed in chondrocytes at 5 days post-fertilization (dpf), and sox10:DsRed becomes restricted to a subset of joint chondrocytes at 60 and 90 dpf. The arrow shows the developing jaw joint at 5 dpf. (D,E) Antibody staining of the adult jaw joint shows endogenous Sox10 protein (red) in joint cells in 1-year-old uninjured control (D) and interopercular?mandibular (IOM)-transected animals at 28 days post-ligament transection (dplt) (E). (F) Quantification of Sox10+ cells as a percentage of total Hoechst+ cells at the jaw joint articular surface. Individual data points, mean, and standard error of the mean are shown. The p-value is calculated by two-tailed Student?s t-test. (G,H) Antibody staining for PCNA (green) and Sox10 (red) of adult jaw joints from uninjured controls (G,G?) and IOM-transected animals at 21 dplt (H,H?). The white arrowheads indicate double-positive PCNA+/Sox10+ nuclei. (I) Quantification of double-positive PCNA+/Sox10+ chondrocyte nuclei as a percentage of total Hoechst-stained nuclei at the jaw joint articular surface. Individual data points, mean, and standard error of the mean are shown. The p-value was calculated using Welch?s two-tailed t-test. AA, anguloarticular bone; Q, quadrate bone. Scale bars = 50 ?m.
Image
Figure Caption
Acknowledgments
This image is the copyrighted work of the attributed author or publisher, and
ZFIN has permission only to display this image to its users.
Additional permissions should be obtained from the applicable author or publisher of the image.
Full text @ Front Cell Dev Biol

