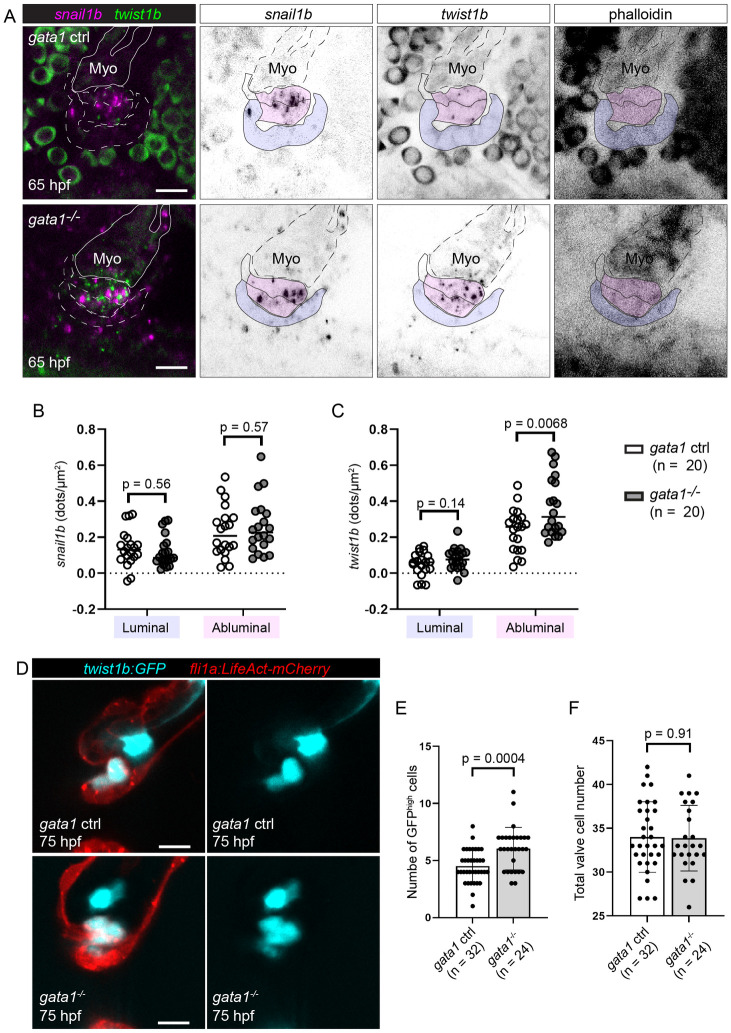
Fig 11
(A) Representative images of the developing superior AV valves at 65 hpf that have been stained using snail1b and twist1b probes in gata1 controls (top row) and mutants (bottom row). Our interpretation of valve morphology superimposed on the images and blue (luminal) and magenta (abluminal) regions are used for quantifications in (B) and (C). (B, C) Dot plots showing the number of detected dots, each corresponding to1 snail1b (B) or 1 twist1b (C) mRNA molecule, in luminal and abluminal valve regions (shaded in purple and pink, respectively, in (A)). Statistical significance was calculated using Student t test. (D) Example images of gata1 mutants and controls in the Tg(twist:GFP);Tg(fli1a:Lifeact-mCherry) background. (E) Graph showing the number of cells with bright GFP signal (GFPhigh cells) in Tg(twist:GFP);Tg(fli1a:Lifeact-mCherry) gata1 mutants and controls. Statistical significance was determined using Student t test. (F) Total valve cell number in the same embryos used for quantification in (E). Statistical significance was determined using Student t test. Scale bars: 10 ?m. AV, atrioventricular valve; hpf, hours postfertilization; Myo, myocardium.

