
|
Fig 8
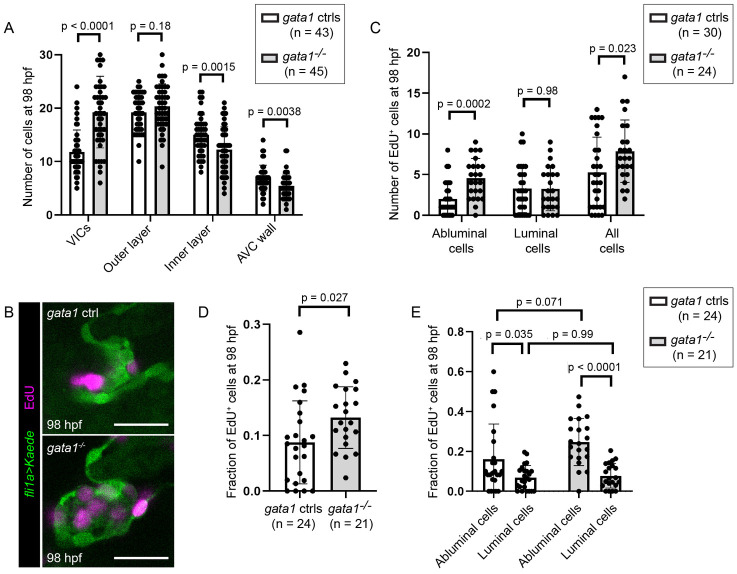
(A) Number of cells in different valve regions at 98 hpf. p-Values based on unpaired t test. (B) Representative images of 98 hpf gata1 control and mutant valves incubated with EdU from 74 to 98 hpf. Scale bars: 20 ?m. (C) Graph showing number of EdU positive cells in 98 hpf gata1 controls and mutant valves. p-Values are based on unpaired t tests. (D) Graph showing fraction valve cells that stained positive for EdU in 98 hpf gata1 controls and mutant valves. p-Values are based on Welch t test. (E) Graph showing fraction of abluminal and luminal cells in 98 hpf gata1 controls and mutant valves that stained positive for EdU. p-Values are based on 2-way ANOVA. AVC, atrioventricular canal; hpf, hours postfertilization; VIC, valve interstitial cell.