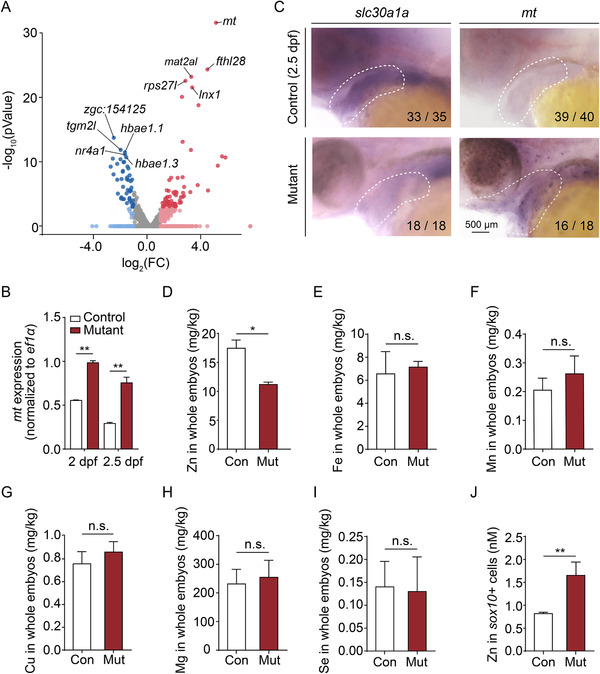
FIGURE 5
Zinc levels are increased in the pharyngeal arch (PA) of mutant embryos. (A) Volcano plot showing the relative expression of metal ion?binding genes from Gene Ontology (GO):0046872. Blue and red dots indicate significantly (p < 0.05) downregulated and upregulated genes, respectively, and the mt gene is indicated. Gray dots indicate genes that were neither upregulated nor downregulated (p > 0.05). (B) Summary of mt mRNA measured in sox10 + cells obtained from control and mutant embryos at 2 dpf and 2.5 dpf. (C) Whole?mount in situ hybridization of the indicated genes in control and mutant embryos at 2.5 dpf. (D?I) Summary of Zn (D), Fe (E), Mn (F), Cu (G), Mg (H), and Se (I) concentration measured in control and mutant embryos using inductively coupled plasma mass spectrometry (ICP?MS) (n = 2 sets of 100 embryos/group). (J) Summary of Zn concentration measured in sox10 + cells isolated from control and mutant embryos at 2 dpf using a fluorescent zinc indicator (n = 3 sets of 30,000 cells/group). *p < 0.05, **p < 0.01, n.s., not significant

