
|
FIGURE 4
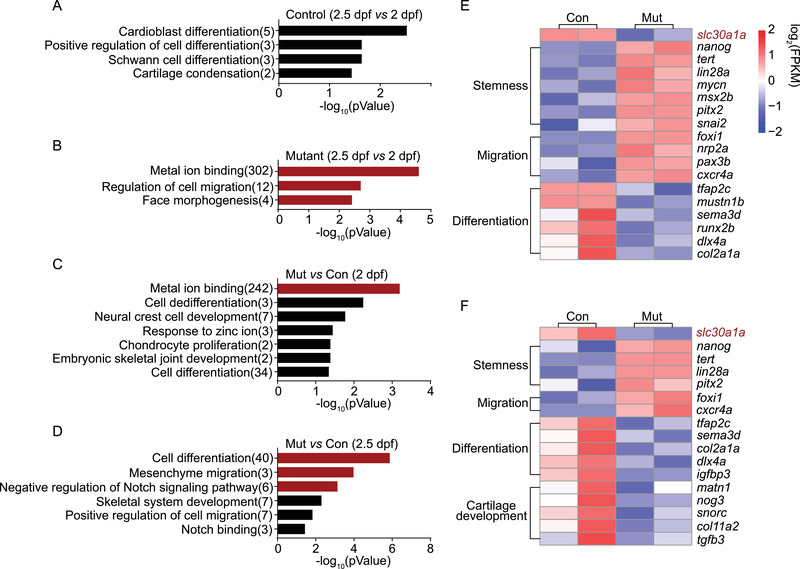
SMART?seq data analysis of neural crest development and zinc concentration. (A) Summary of significantly enriched pathways (p < 0.05) enriched Gene Ontology (GO) terms in control embryos at 2.5 dpf versus control embryos at 2 dpf. In panels A?D, black and red bars indicate p < 0.05 and p < 0.005, respectively. (B) Summary of the most highly enriched GO terms in mutant embryos at 2.5 dpf versus mutant embryos at 2 dpf. (C and D) Summary of significantly enriched GO terms in mutant embryos versus control embryos at 2 dpf (C) and 2.5 dpf (D). (E and F) Heatmaps showing the expression of the indicated marker genes in control and mutant embryos at 2 dpf (E) and 2.5 dpf (F)