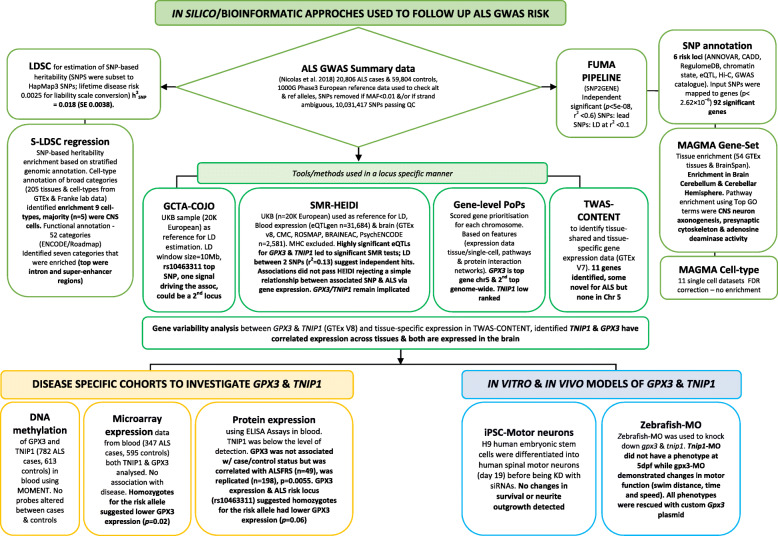
Fig. 1
Summary of the in silico, in vitro and in vivo follow-up of ALS GWAS findings. Causal genes/genomic loci implicated by a SNP association are not necessarily the closest (empirical estimate of those that are ~ 30%, Zhu et al. [18]) and the flowchart provides a stepped example on how this paper integrated complementary bioinformatic methods on GWAS summary statistics to prioritise GPX3 and TNIP1 for follow-up in disease cohorts and in vitro (human spinal motor neurons) and in vivo (zebrafish-MO) models. Relevant bioinformatic tools and processes used in this paper are described [5, 18?23]. GWAS genome-wide association study, h2SNP proportion of heritability explained by SNPs, FUMA Functional Mapping and Annotation pipeline, S-LDSC Stratified Linkage Disequilibrium Score regression, GCTA-COJO conditional and joint analysis, SMR-HEIDI Summary Mendelian Randomisation and the HEterogeneity In Dependent Instruments test, TWAS-CONTENT transcriptome-wide association study and context-specific genetics test, PoPS Polygenic Priority Score, siRNA short interfering RNA, iPSC induced pluripotent stem cells, Zebrafish-MO zebrafish morpholino, UKB UK-biobank, chr chromosome

