IMAGE

Figure 1

ID
ZDB-IMAGE-211230-54
Genes
Source
Figures for Suzuki et al., 2021
Image
Figure Caption

Figure 1

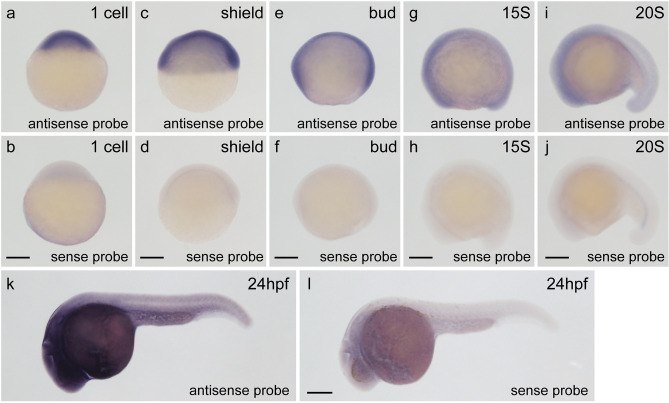
Expression of the trrap gene during zebrafish embryogenesis. (a,b) One-cell stage. (c,d) Shield stage. (e,f) Bud stage. (g,h) Fifteen-somite (15S) stage. (i,j) Twenty-somite (20S) stage. (k,l) Twenty-four hours post-fertilization (hpf). All pictures are lateral views. Dorsal is right (c). Anterior is left (el). The expression of the trrap gene was examined by whole-mount in situ hybridization (WISH) using an antisense trrap DIG probe (a,c,e,g,i,k) or a sense trrap DIG probe (b,d,f,h,j,l). Scale bar, 200 μm.

Figure Data
Acknowledgments
This image is the copyrighted work of the attributed author or publisher, and ZFIN has permission only to display this image to its users. Additional permissions should be obtained from the applicable author or publisher of the image. Full text @ Sci. Rep.