
|
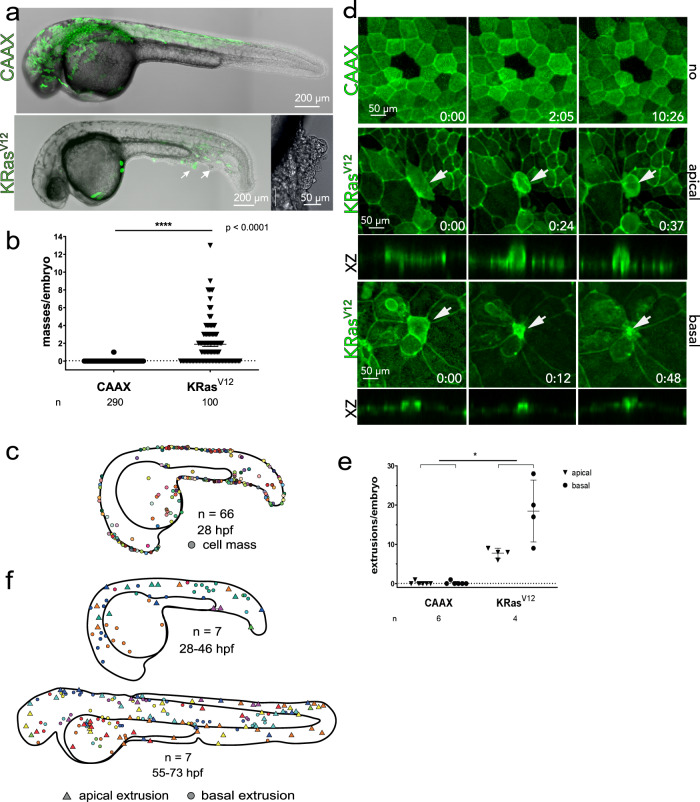
Fig. 1
a 26 hpf wild-type zebrafish embryos expressing krt4:EGFP-CAAX or dt-KRasV12, masses indicated by black arrowheads and inset. b Mean of cell masses per embryo � SEM, P < 0.0001 by a Mann?Whitney test, n = embryos. c Map of where cell masses occur, as observed at 28 hpf. d Stills from time-lapse imaging (hh:mm) of periderm:Lifeact-EGFP mosaically expressing EGFP-CAAX or EGFP-dt-KRasV12, showing hallmarks of apical and basal extrusion, with XZ sections beneath showing constriction at the base or apex, respectively (white arrows delimit ring constricting). e Number of apical and basal extrusions in EGFP-CAAX or dt-KRasV12 embryos. Data are mean � SEM, **P < 0.02 by a Mann?Whitney test for apical and basal extrusions pooled together. f Maps indicating where apical and basal extrusions occur in 28-46 hpf embryos and 55?73 hpf embryos, where different colours represent different fish analyzed, n. Source data are provided as a Source Data file.