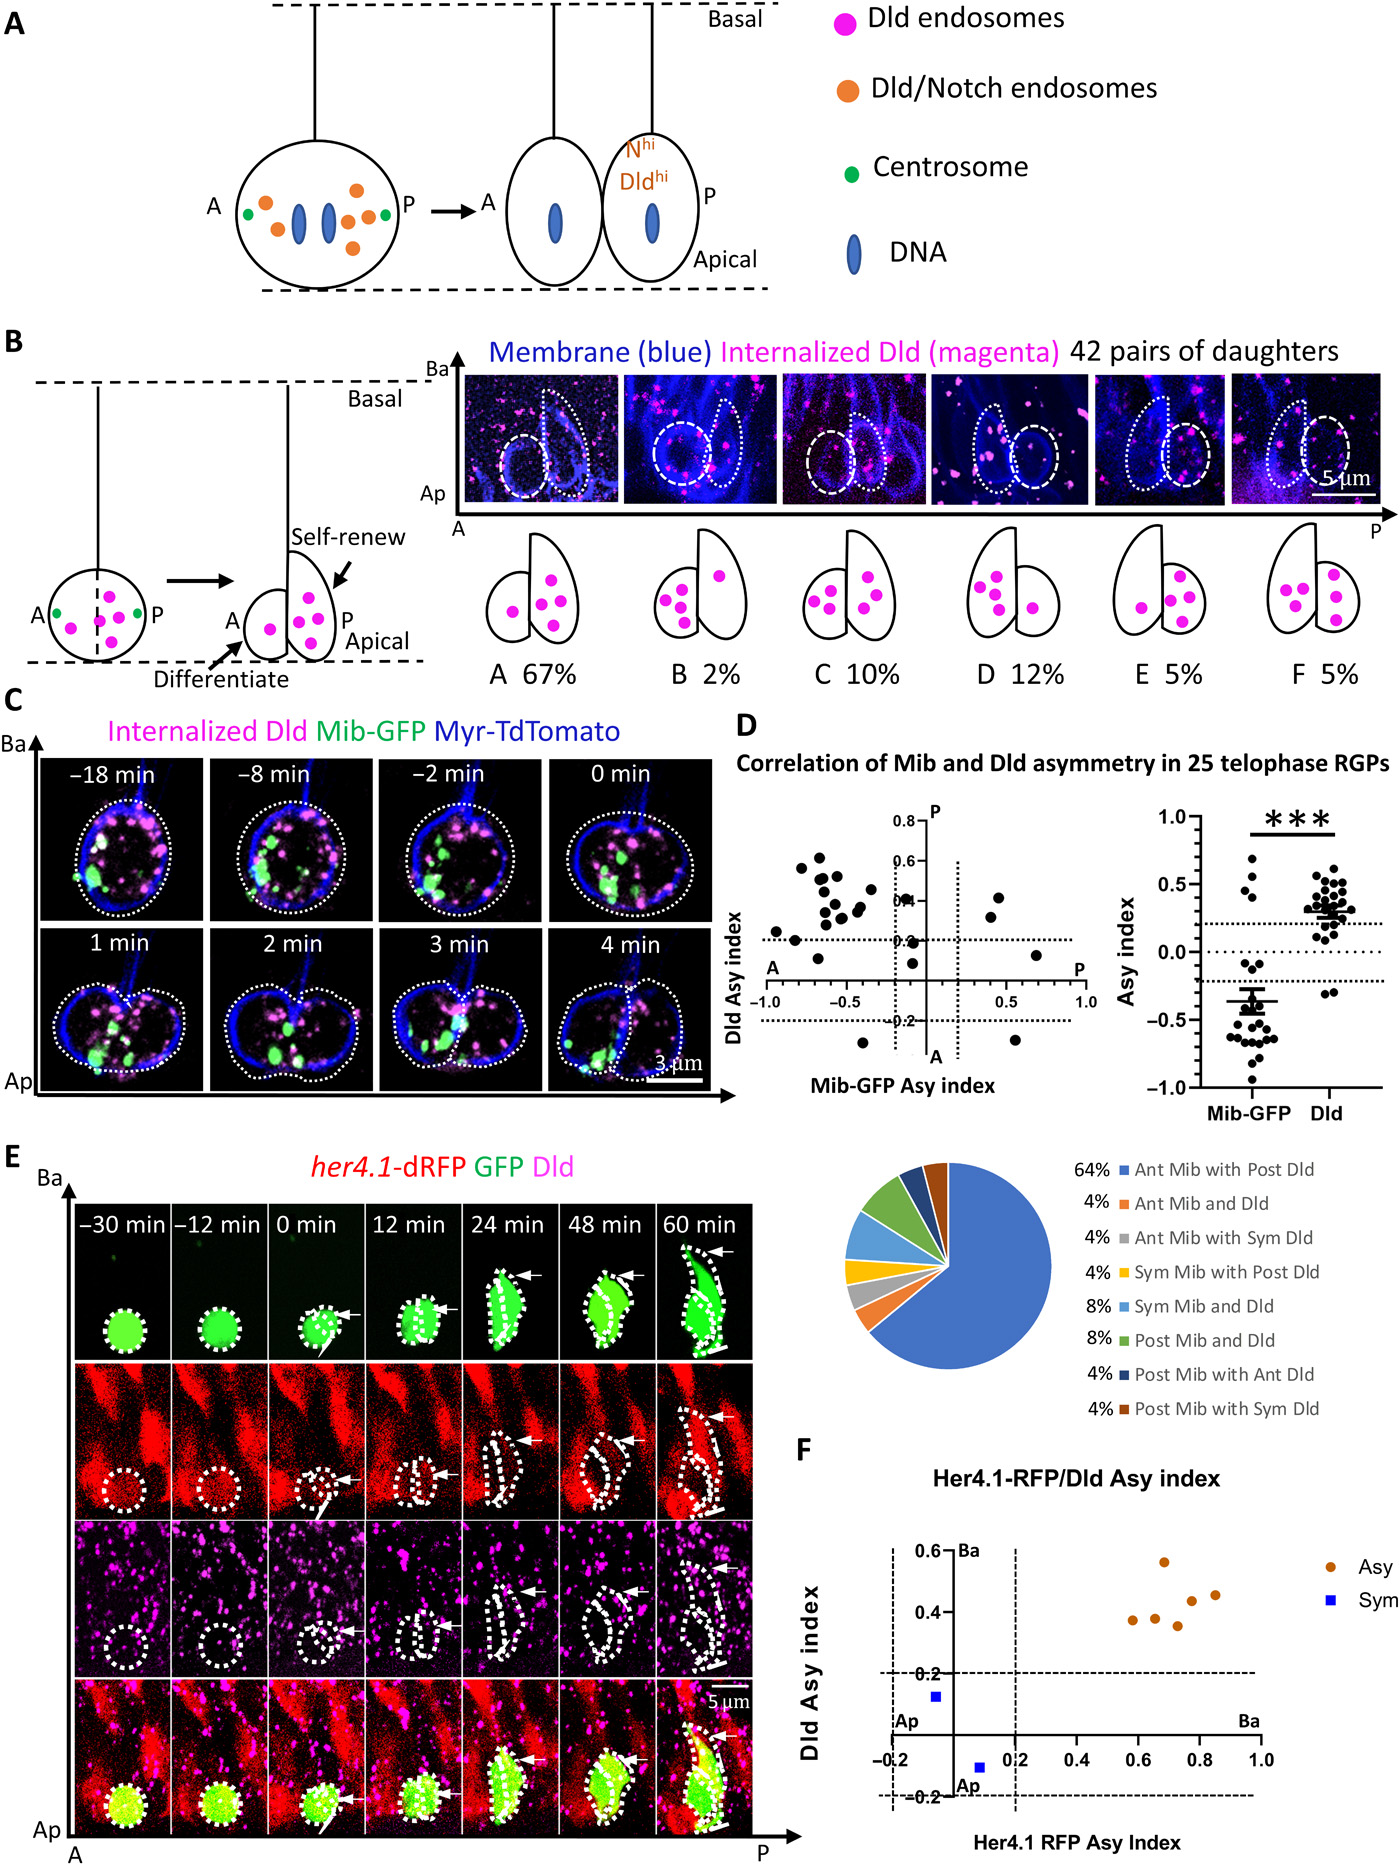
Fig. 2 Dld endosomes are preferentially segregated into the Notchhi daughter following RGP division.(A) Schematic depicting the asymmetry of Dld endosomes (Dldhi) and Notch activity (Nhi) in daughter cells. (B) Topology and statistics of relative daughter cell position along A-P (anteroposterior) and Ap-Ba (apicobasal) axes after horizontal division. MIP of 5-?m z-stacks (1-?m z-step) is shown. (C) Time-lapse images showing that Dld endosomes and Mib are segregated into different daughter cells following RGP division (n = 25). MIP of 5-?m z-stacks (1-?m z-step) is shown. The time interval between z-stacks is 20 s, and the total acquisition time is 30 min. (D) The top left graph plots individual RGP?s asymmetry indices for Mib-GFP (x axis) and internalized Dld (y axis). The top right graph shows the distribution of asymmetry indices for Mib-GFP and Dld endosomes; the dotted lines indicate the threshold of |0.2| for calling asymmetry. ***P < 0.0001, t = 6.549, df = 48, n = 25; unpaired two tailed t test. Mean with SEM is shown. The bottom pie chart shows the percentage of RGPs with indicated distribution patterns. n = 25 RGPs, from eight embryos of five repeat experiments. (E) Time-lapse images of a clonally labeled RGP (green) showing preferential segregation of internalized Dld to her4.1-dRFPhi daughter. MIP of 8-?m z-stacks (1-?m z-step) is shown. The time interval between z-stacks is 6 min, and the total acquisition time is ~10 hours. (F) Plot for quantifying her4.1-dRFP and internalized Dld in daughter RGPs 1 hour after anaphase. n = 8 RGPs, from eight embryos of six repeat experiments.
Image
Figure Caption
Acknowledgments
This image is the copyrighted work of the attributed author or publisher, and
ZFIN has permission only to display this image to its users.
Additional permissions should be obtained from the applicable author or publisher of the image.
Full text @ Sci Adv

