
Image
|
Figure Caption
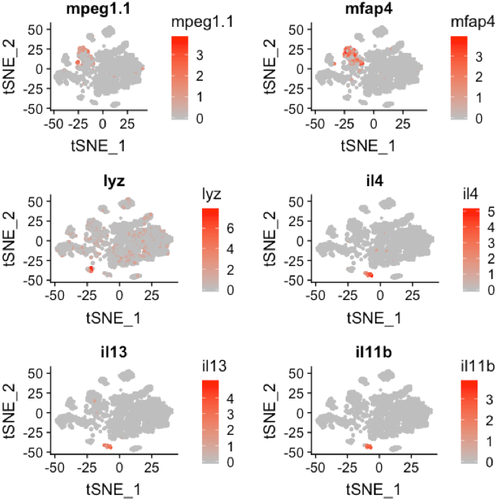
Fig. 3.4 t-SNE plot overlaid with gene expression for genes specific to macrophages (mpeg1.1 and mfap4), neutrophils (lyz), and lymphocytes (il4, il13, and il11b). The color scale represents the normalized expression counts for each gene ranging from lowest (gray) to highest (red).
Acknowledgments
This image is the copyrighted work of the attributed author or publisher, and
ZFIN has permission only to display this image to its users.
Additional permissions should be obtained from the applicable author or publisher of the image.
Full text @ EMBO Rep.