
Image
|
Figure Caption
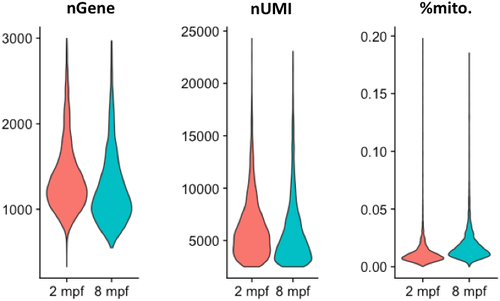
Fig. 1.2 Violin plots depicting the number of genes (nGene), number of unique RNA molecules detected (nUMI?number of Unique Molecule Identifiers) and the percentage of reads mapped onto the mitochondrial genome for the cells profiled in the zebrafish thyroid gland atlas.
Acknowledgments
This image is the copyrighted work of the attributed author or publisher, and
ZFIN has permission only to display this image to its users.
Additional permissions should be obtained from the applicable author or publisher of the image.
Full text @ EMBO Rep.