
|
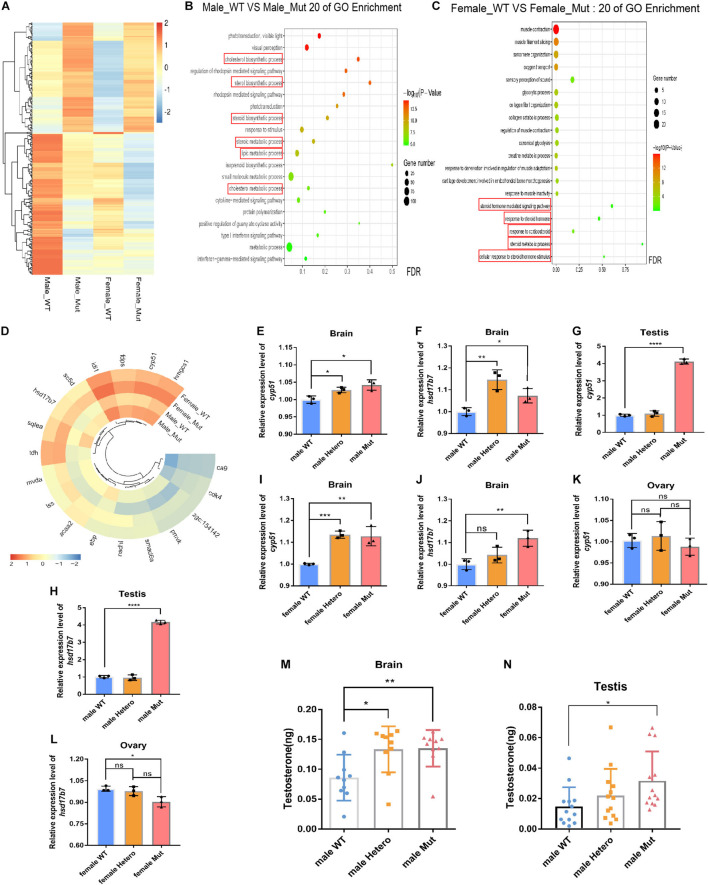
FIGURE 3
Transcriptome sequencing of the brain in the male and female atrn mutants, and steroid synthesis-related genes are upregulated in the mutant. (A) Heat map shows genes that are differentially expressed in the brain of wild type and mutants of different sexes. N = 3. (B) GO enrichment dot bubble of male wild type and male mutants indicate that GO terms related to steroid synthesis are affected. (C) GO enrichment dot bubble of female WT and female Mut indicate that GO terms related to steroid synthesis are affected. (D) Circular heatmap shows upregulation of genes related to steroid synthesis. qRT-PCR results for cyp51 and hsd17b7 gene expression in the brain (E–J) and testis of WT, heterozygotic (Hetero) and Mut zebrafish at 4 mpf, but there is no expression difference between the brain and ovary of the female adult zebrafish (K,L). N = 9. Testosterone ELISA results show that the content of testosterone in the brain of the male mutant (M) and testis is significantly increased (N). N = 10. Data are shown as mean ± SD; *p < 0.05; **p < 0.01; ***p < 0.001; ****p < 0.0001; ns, no significance (p > 0.05). Heatmap was plotted by http://www.bioinformatics.com.cn, an online platform for data analysis and visualization.