Figure 3.
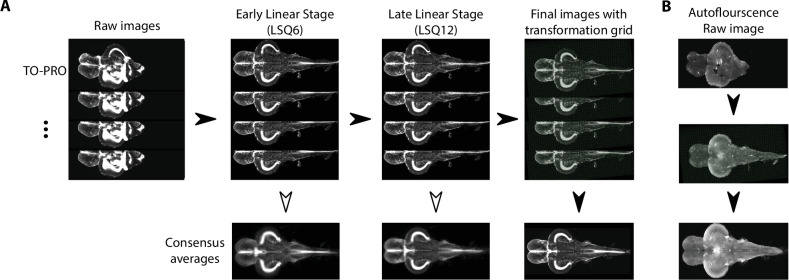
(A) Raw TO-PRO images from 17 fish were first aligned using linear transformations (LSQ6 and LSQ12) followed by a final nonlinear transformation (right). Deformation grids at each stage are overlaid. Consensus average images at each stage of the pipeline are given below. (B) Raw autofluorescence images (top) acquired at the same time as the TO-PRO images were registered into the same space using the transformations derived from TO-PRO registration (middle). Images were then averaged together to generate a corresponding autofluorescence average in the same anatomical space as the TO-PRO images (bottom).
Image registration pipeline.
Image
Figure Caption
Acknowledgments
This image is the copyrighted work of the attributed author or publisher, and
ZFIN has permission only to display this image to its users.
Additional permissions should be obtained from the applicable author or publisher of the image.
Full text @ Elife

