
|
Figure 5
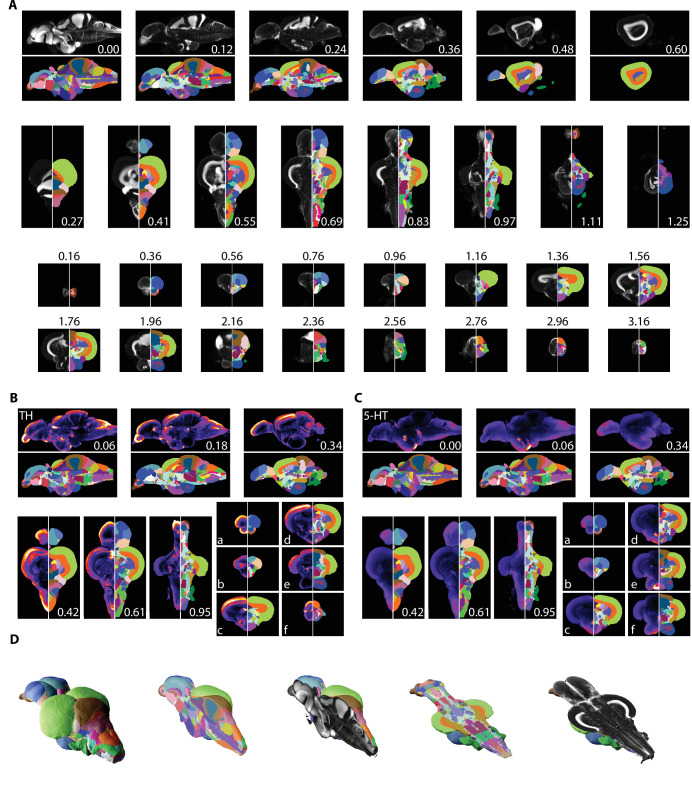
(A) Averaged and registered TO-PRO images alongside the atlas segmentation. For sagittal (top), horizontal (middle), and coronal (bottom) planes, numbers are distance (in mm) from the midline, top, and anterior-most portion of the brain, respectively. (B, C) Averaged and registered TH and 5-HT-stained images where hotter colors indicate a stronger signal. Numbers same as in (A). Slices in each plane were chosen to show regions containing high levels of staining (see Results for description). (D) Three-dimensional representation of the segmentation with a sagittal and horizontal cutaway overlaid with the TO-PRO stain of the atlas.
Segmentation of the adult zebrafish brain atlas (AZBA).