Figure 7
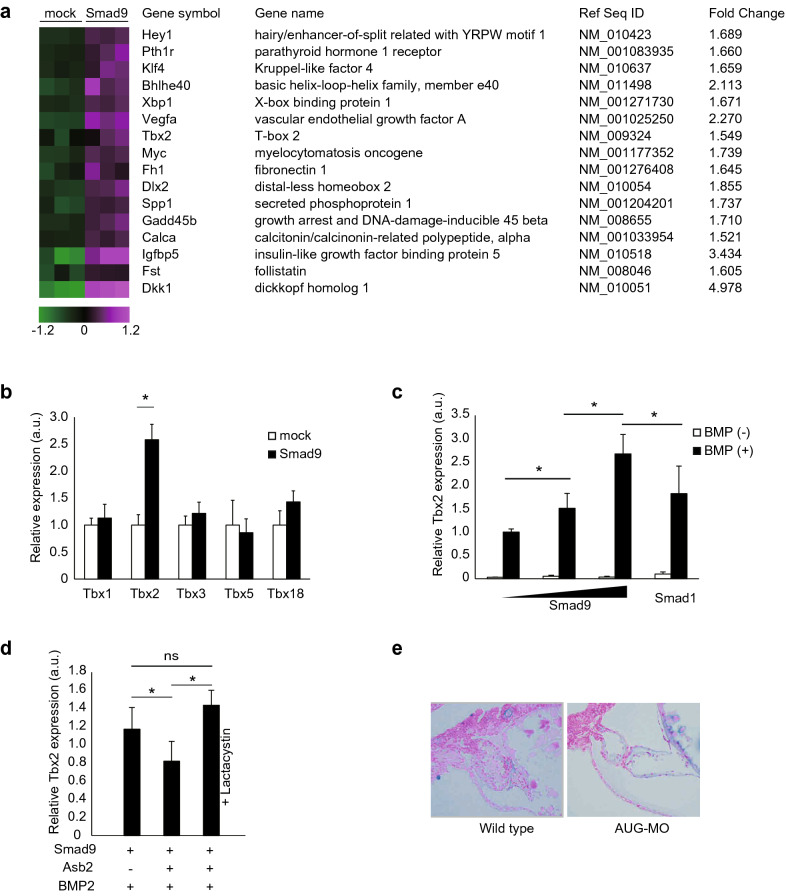
Tbx2 expression is regulated by SMAD9. (a) Search for SMAD9 target genes through comprehensive gene expression analysis. P19CL6 cells were transfected with either the mock vector or the vector coding Flag-SMAD9 and treated with 100 µM BMP2 for 24 h. RNA was collected and subjected to microarray analysis. Sixteen BMP-responsive genes were significantly upregulated by forced expression of SMAD9. (b) P19CL6 cells were transfected with either the mock vector or the vector encoding Flag-SMAD9 and treated with 100 µM BMP2 for 24 h. The expression levels of indicated genes were determined using quantitative real-time PCR. Among Tbx family, only Tbx2 was significantly induced by forced expression of SMAD9 under BMP2 stimulation. (c) From the left, 0, 0.1, and 1.0 µg of vector encoding Flag-SMAD9 and 1.0 µg of vector coding Flag-SMAD1 were transfected into P19CL6 cells. The expression level of Tbx2 was positively correlated with the amount of SMAD9. Greater induction of Tbx2 was observed upon transfection of SMAD9 compared to SMAD1. (d) Tbx2 expression was induced by treatment with BMP2. The expression level of Smad9 was blunted by co-expression of ASB2. The blunting effect of ASB2 was cancelled by treatment with 10 µM lactacystin for 16 h. (e) The histological section of zebrafish was subjected to alcian blue staining to visualize excess extracellular matrix induced by misexpression of Tbx2. The data are shown as the mean ± s.d. Statistical analysis was performed using one-way ANOVA with Tukey?s multiple comparison tests. *p < 0.05; ns, not significant; a.u., arbitrary unit.

