
Image
|
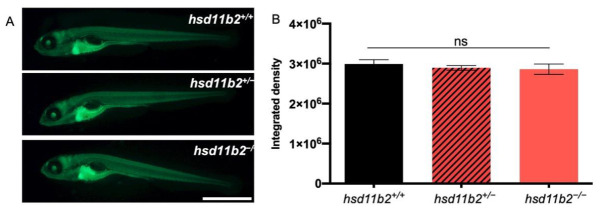
Figure Caption
Figure 5
Analysis of GC-dependent transcriptional activities. (A) Representative pictures of 5-dpf hsd11b2+/+, hsd11b2+/?, and hsd11b2?/? larvae in Tg(9xGCRE-HSV.Ul23:EGFP)ia20 transgenic background. (B) Fluorescence quantification of 5-dpf hsd11b2+/+, hsd11b2+/?, and hsd11b2?/? larvae in Tg(9xGCRE-HSV.Ul23:EGFP)ia20 transgenic background. Scale bar = 1 mm. Statistical significance was determined by Student?s t-test. ns = not significant. Mean � SEM.
Figure Data
Acknowledgments
This image is the copyrighted work of the attributed author or publisher, and
ZFIN has permission only to display this image to its users.
Additional permissions should be obtained from the applicable author or publisher of the image.
Full text @ Int. J. Mol. Sci.