
Fig 2
|
Fig 2
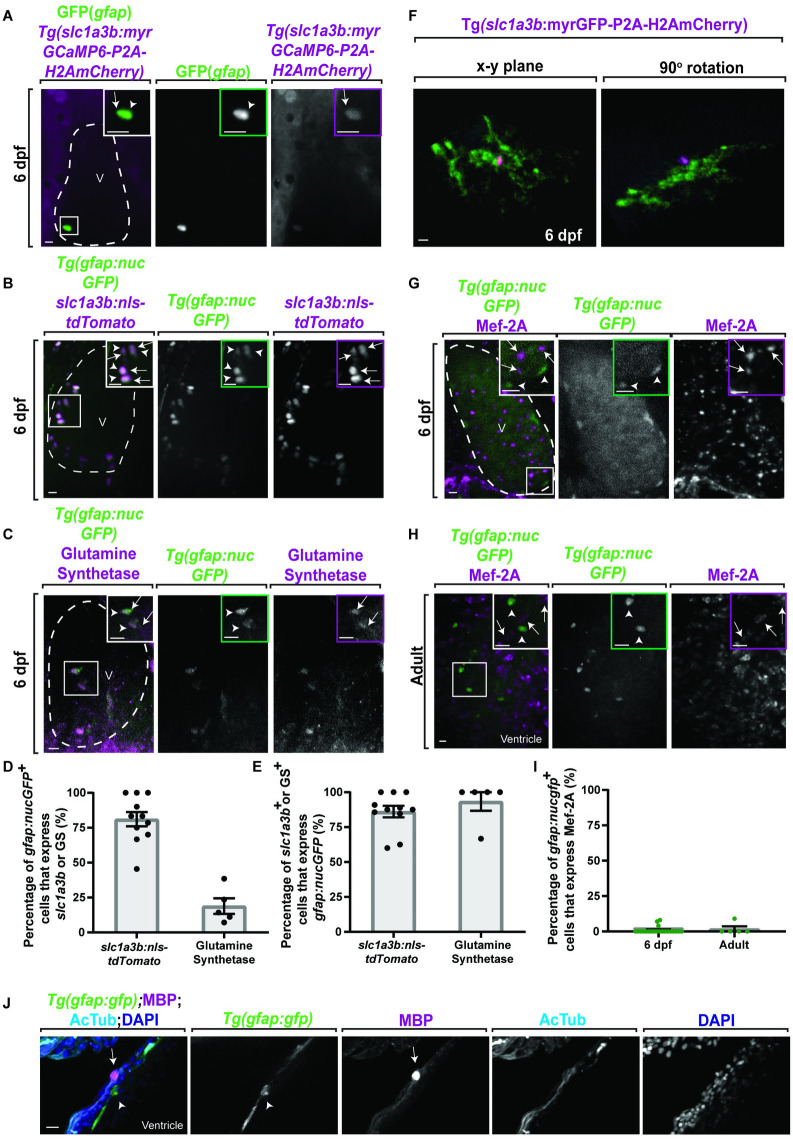
(A) Confocal 20 ?m z-projection of 6 dpf Tg(gfap:nucGFP);Tg(slc1a3b:myrGcAMP6-P2A-H2AmCherry) ventricle stained with GFP. GFP+ cells (white arrowhead) colocalize with H2AmCherry+ cells (white arrow). (B) Confocal 20 ?m z-projection of 6 dpf Tg(gfap:nucGFP) ventricle injected with slc1a3b:nls-tdTomato. nucGFP+ cells (white arrowheads) colocalize with tdTomato+ cells (white arrows). (C) Confocal 20 ?m z-projection of 6 dpf Tg(gfap:nucGFP) ventricle stained with glutamine synthetase. nucGFP+ cells (white arrowheads) colocalize with glutamine synthetase+ cells (white arrows). (D) Quantification of the percentage of gfap:nucGFP+ cells that express slc1a3b:nls-tdTomato (n = 124 cells) or GS (n = 76 cells). (E) Quantification of the percentage of slc1a3b:nls-tdTomato+ (n = 115 cells) or GS+ (n = 15 cells) cells that express gfap:nucGFP. (F) Confocal 10 ?m z-projection of a 6-dpf Tg(slc1a3b:myrGFP-P2A-H2AmCherry)+ cell morphology. (G, H) Confocal 20 ?m z-projections of (G) 6 dpf Tg(gfap:nucGFP) ventricle and (H) adult Tg(gfap:nucGFP) ventricle stained with Mef-2A. The nucGFP+ cells (white arrowhead) do not colocalize with Mef-2A puncta. Inlet area is denoted by white dotted box. (I) Quantification of percentage of gfap:nucGFP+/Mef-2A+ cells per 6 dpf (n = 211 cells) and adult ventricles (n = 49 cells). (J) Confocal 10 ?m z-projection of adult Tg(gfap:gfp) ventricles stained with MBP and AcTub. MBP (white arrow) does not colocalize to gfap+ cells (white arrowhead). Inlet areas are denoted by white box. Data are represented as mean � SEM. Scale bar equals 10 ?m. Statistics summarized in S1 Table. See S1 Data for raw data. AcTub, acetylated tubulin; dpf, days postfertilization; GS, glutamine synthetase; MBP, myelin basic protein; V, ventricle.