
|
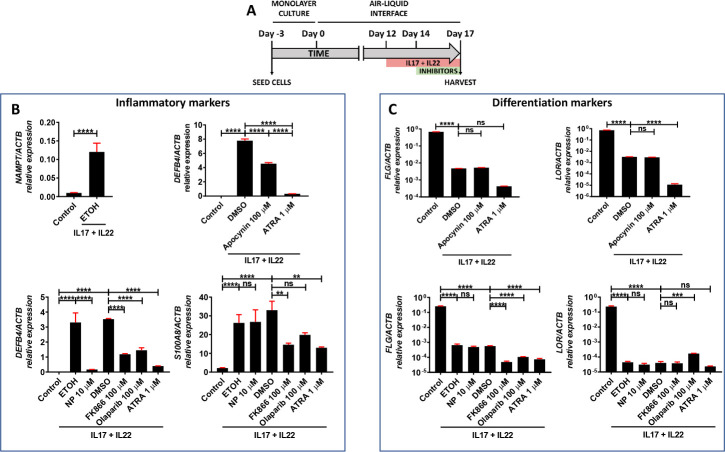
Fig 6
(A–C) Transcript levels of the indicated genes encoding inflammation (B) and differentiation (C) markers were determined in human organotypic 3D skin models pretreated with 30 ng/ml IL17A and IL22 in the presence of vehicles (ETOH and DMSO) or the indicated inhibitors. The mean ± SEM for each group is shown. The results are representative of 3 independent experiments. p-Values were calculated using 1-way ANOVA and Tukey multiple range test. ns, not significant. *p ≤ 0.05, **p ≤ 0.01, ***p ≤ 0.001, ****p ≤ 0.0001. The data underlying this figure can be found in S1 Data. ANOVA, analysis of variance; ATRA, all-trans retinoic acid; NP, N-phenylmaleimide.