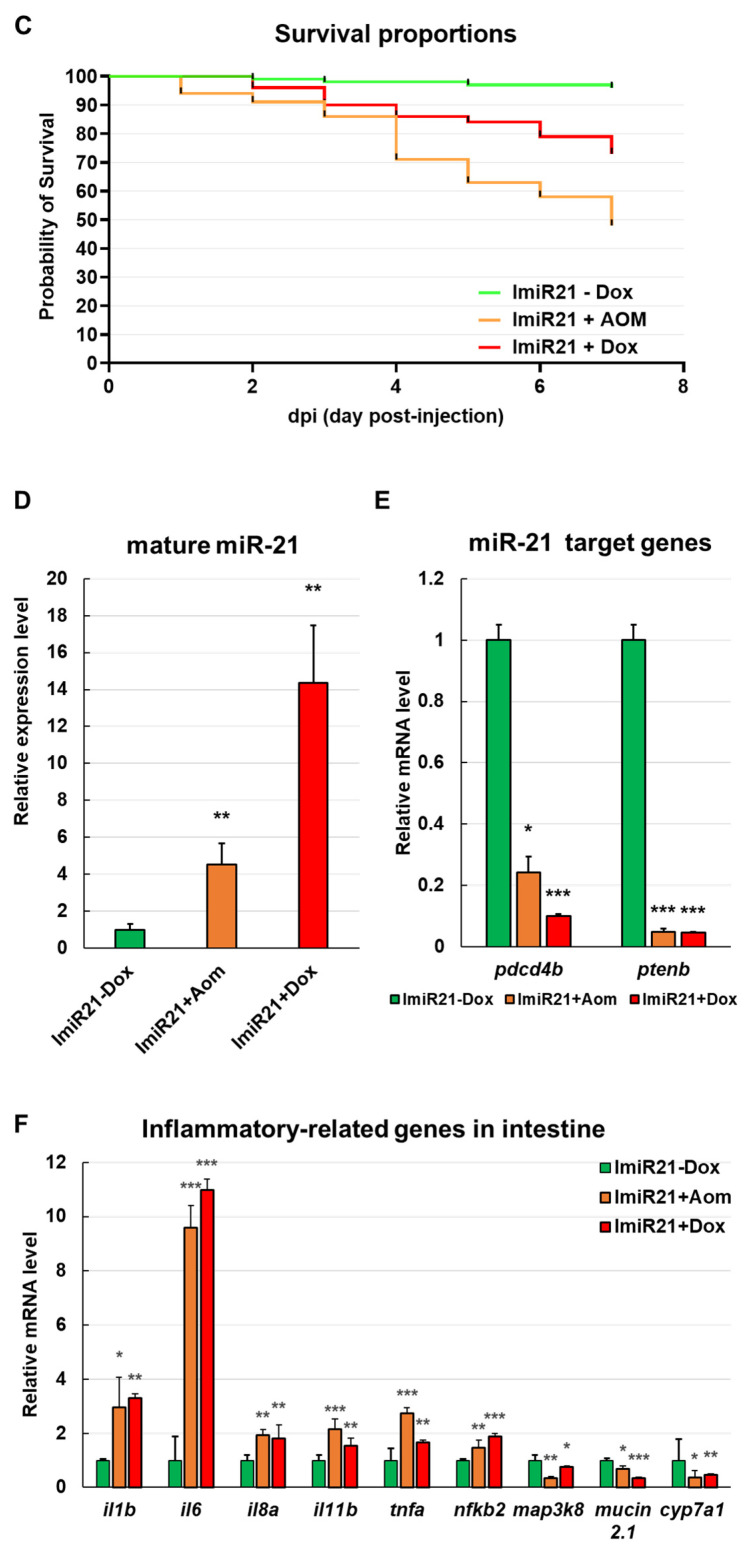
Figure 3
Characterization of expression profiles of inflammation-related genes in ImiR-21 larvae. (A) Schematic diagram of the strategy of doxycycline (Dox) and azoxymethane (AOM) treatment in ImiR-21. ImiR-21 + AOM: ImiR-21 larvae were injected with AOM (100 ng/4.6 nL) at 14, 16, and 18 days post-fertilization (dpf). ImiR-21 + Dox: ImiR-21 larvae were treated with 25 ?g/mL Dox from 3 to 21 dpf. Morphology and gene regulatory patterns were analyzed at 21 dpf. (B) Intestinal morphology of ImiR-21 at 21 dpf. ImiR-21 expressed a strong ZsGreen signal in the zebrafish intestine. Upon Dox treatment, the mCherry (and miR-21) signal was induced in the intestine. The intestine was swollen in ImiR-21 + AOM and ImiR-21 + Dox. Scale bar: 200 ?m. (C) Survival proportions of ImiR-21 from 14 to 21 dpf (p < 0.0001 n = 100 in 3 independent experiments). (D) RT-qPCR analysis of mature miR-21 level in intestine of ImiR-21 ± Dox and ImiR-21 + AOM at 21 dpf. U6 was used as a reference gene for expression normalization. (E) The mRNA expression level of pdcd4b and ptenb in the intestines of ImiR-21 ± Dox and ImiR-21 + AOM at 21 dpf. (F) The mRNA expression level of inflammation-related genes in the intestine of ImiR-21 ± Dox and ImiR-21 + AOM at 21 dpf. Gene expression levels were normalized to gapdh levels in ImiR-21?Dox for panels (E,F). Statistically significant differences from PBS-injected WT control or ImiR-21?Dox are denoted by * (p < 0.05), ** (p < 0.01), and *** (p < 0.001) for panels (D?F).

