Image
Figure Caption
Figure 6
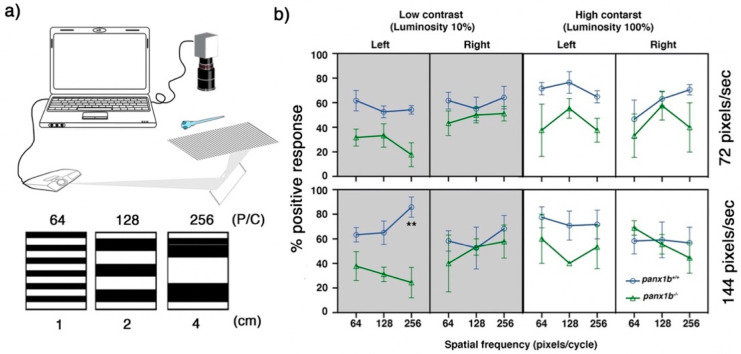
Figure 6. Optomotor response (OMR) declines in the absence of functional Panx1b. (a) The OMR setup. Three spatial frequencies at two different speed rates and two luminosity levels were used to assess larval zebrafish?s visual acuity. P/C = pixel/cycle (b) The percentage of positive response (% PPR) explains the average number of larvae that responded to a particular setting. The PPR values for each setting are the average of four tests ± SEM. In all tested settings, panx1b?/? were able to elicit an appropriate response, as observed in TL controls. However, their visual acuity was lower than controls when the direction of motion was towards the left. The difference between genotypes? PPR for the left-ward motion became very significant at a spatial frequency of 256, with a speed of 144, and a low contrast setting (n = 40). The ?lm? and the model statistical ?summary? functions were used to fit a regression model. The significant differences were calculated using the ?TukeyHSD? function in R. Significance: ** p-value < 0.01. Error bars = SEM.
Figure Data
Acknowledgments
This image is the copyrighted work of the attributed author or publisher, and
ZFIN has permission only to display this image to its users.
Additional permissions should be obtained from the applicable author or publisher of the image.
Full text @ Int. J. Mol. Sci.

