Image
Figure Caption
Figure 5
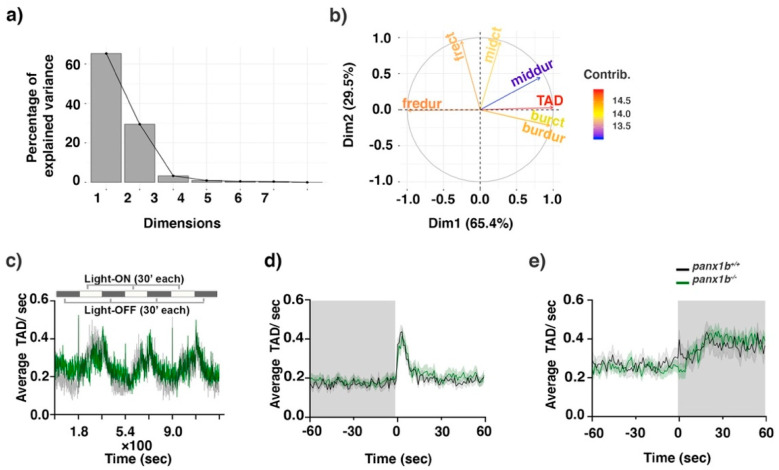
Figure 5. Visual-motor motor response (VMR) changes in panx1b?/? larvae at 6dpf. (a) Principal component analysis (PCA) transforming the VMR multidimensional data. The scree plot shows that Dimensions 1 and 2 capture more than 65.4% and 29.5% of the data variance. (b) The variable correlation plot represented the coordinates of the variables in the first two dimensions. The variables were colored from blue to red as their contribution to PCs increases. Total activity duration (TAD; in color red) showed the highest contribution to the variability in Dimension 1 and was chosen to visualize differences between genotypes. (c) The outline of the experimental paradigm is shown on top. The line graph shows the average TAD of panx1b?/? and panx1b+/+ (TL) larvae from a representative test with n = 24 larvae for each genotype. The activity was defined as the fraction of frames per second that a larva spent swimming (see methods for the detailed information). (d,e) The results for average Light-ON and Light-OFF VMR are shown from 1 min before the light switch to 1 min after the light switch. The color ribbons surrounding the average activity line graph correspond to 1 S.E.M. The values are the average of the second trial from four independent tests with n = 48 larvae for each genotype. The Light-ON and Light-OFF periods are indicated by white and black bars at the top of the panels. The ?nparcomp? analysis was used for multiple comparisons and simultaneous confidence intervals.
Figure Data
Acknowledgments
This image is the copyrighted work of the attributed author or publisher, and
ZFIN has permission only to display this image to its users.
Additional permissions should be obtained from the applicable author or publisher of the image.
Full text @ Int. J. Mol. Sci.

