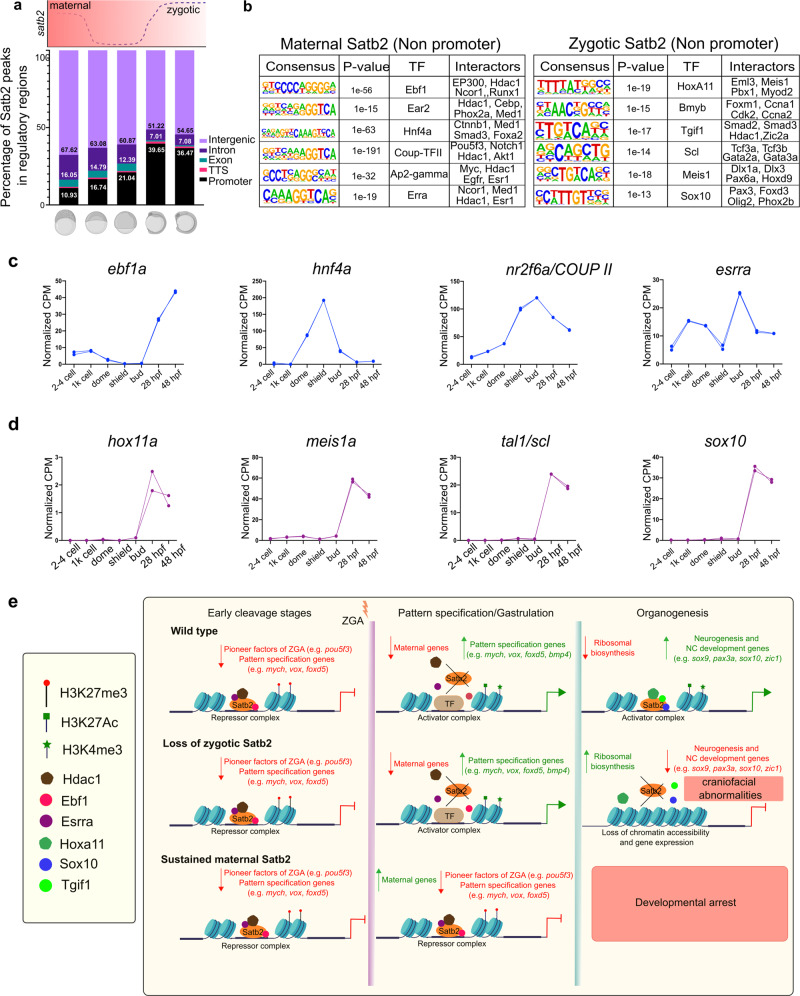
Fig. 7 a Genomic distribution of Satb2 bound regions across developmental stages highlighting a shift in the ratio of non-promoter to promoter bound peaks. Schematic above the bar plot represents the expression pattern of satb2 throughout early embryogenesis. b TFBS for transcription factors at maternal (512 cells stage) and zygotic (14 ss) Satb2. Known interactors for each transcription factor are enlisted. c Line graph depicting mRNA expression dynamics for putative interactors of maternal Satb2; ebf1a, hnf4a, nr2f6a, and esrra across developmental stages as indicated on the x-axis. d Line graph depicting mRNA expression dynamics for putative interactors of zygotic Satb2 namely, hox11a, meis1a, tal1, and sox10, across developmental stages as indicated on the x-axis. e Schematic summary highlighting differential functions of Satb2 during various stages of zebrafish embryogenesis.
Image
Figure Caption
Acknowledgments
This image is the copyrighted work of the attributed author or publisher, and
ZFIN has permission only to display this image to its users.
Additional permissions should be obtained from the applicable author or publisher of the image.
Full text @ Nat. Commun.

