
|
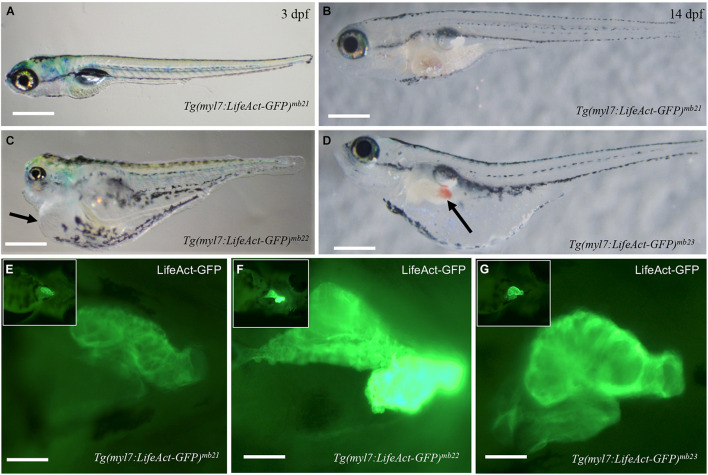
FIGURE 2
Development of pericardial edema in Tg(myl7:Lifeact-GFP)mb22 and Tg(myl7:Lifeact-GFP)mb23 transgenic embryos. (A?D) Morphology of representative transgenic embryos from Tg(myl7:Lifeact-GFP)mb21 line with no edema (A,B), and Tg(myl7:Lifeact-GFP)mb22 (C), and Tg(myl7:Lifeact-GFP)mb23 (D) transgenic lines with edema phenotypes at 3 (C) and 14 dpf (D), respectively. Pericardial edema is indicated by arrows in Tg(myl7:Lifeact-GFP)mb22 (C), and Tg(myl7:Lifeact-GFP)mb23 (D) transgenic larvae. Scale bars: 500 ?m. (E?G) Lifeact-GFP expression in the hearts of Tg(myl7:Lifeact-GFP)mb21 (E), Tg(myl7:Lifeact-GFP)mb22 (F), and Tg(myl7:Lifeact-GFP)mb23 (G) transgenic embryos at 3 dpf. Scale bars: 100 ?m.