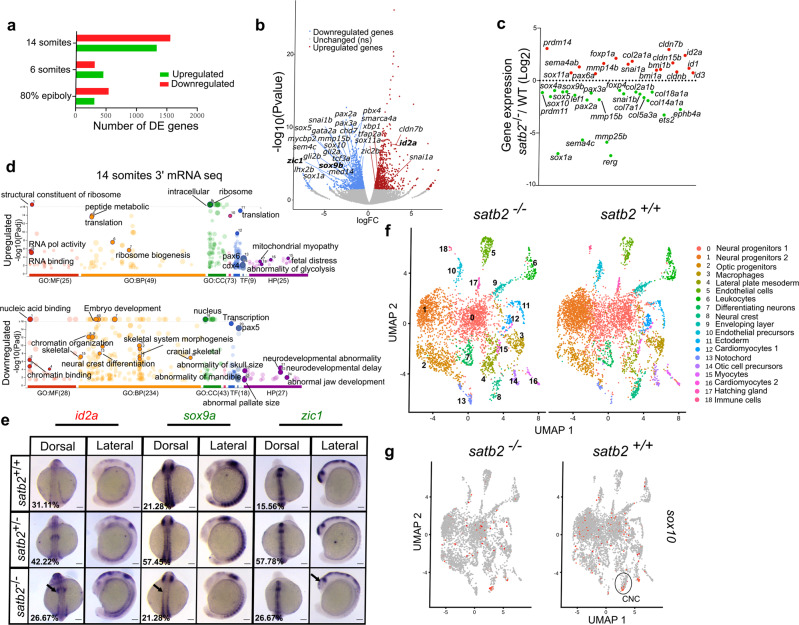
Fig. 2 a Bar plot for the number of upregulated (red) and downregulated (green) genes from 3? mRNA-seq datasets at the respective stages. b Volcano plot of differentially expressed genes at 14 ss embryonic stage. DE genes with FDR < 0.1 and log2 fold change > ▒0.58 are colored as red for significantly upregulated, blue for significantly downregulated, and gray for unchanged or non-significant genes. Few significantly differentially expressed genes representing GO categories neural crest differentiation, neurogenesis, and cranial skeletal system development are highlighted. c Scatter plot for log2 fold change in gene expression of various gene families belonging to the above-mentioned GO categories. d GO analysis of dysregulated genes at 14 ss highlighting significant classes under molecular function (MF), biological processes (BP), cellular components (CC), transcription factors (TF) and human pathology (HP) categories. e Dorsal and lateral view of WISH for id2a (upregulated) n = 48, N = 3; sox9a, n = 47, N = 3 and zic1, n = 45, N = 3 (downregulated). Arrows in the respective images mark the region of maximum differences in the expression pattern. Scale bar = 100 Ám. f UMAP clusters illustrate 19 distinct cell types through integrated scRNAseq analysis on satb2?/? and satb2+/+ embryos at 14 ss. g UMAP highlighting (circled) cranial neural crest cells cluster expressing sox10.
Image
Figure Caption
Acknowledgments
This image is the copyrighted work of the attributed author or publisher, and
ZFIN has permission only to display this image to its users.
Additional permissions should be obtained from the applicable author or publisher of the image.
Full text @ Nat. Commun.

