
|
FIGURE 1
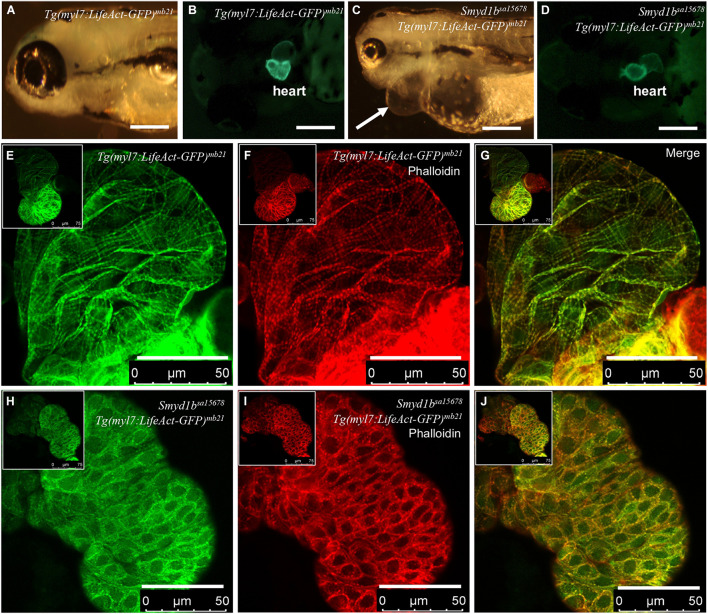
Analysis of congenital cardiomyopathy in smyd1bsa15678 mutant using Tg(myl7:Lifeact-GFP) transgenic zebrafish model. (A?D) Morphology and Lifeact-GFP expression in the heart region of WT Tg(myl7:Lifeact-GFP)mb21 (A,B), and smyd1bsa15678; Tg(myl7:Lifeact-GFP)mb21 mutant (C,D) transgenic larvae at 72 hpf. Pericardial edema is indicated by arrow in smyd1bsa15678; Tg(myl7:Lifeact-GFP)mb21 transgenic mutant larvae (C). Scale bars: 250 ?m. (E?J) Actin think filaments in cardiomyocytes revealed by Lifeact-GFP (E,H) and phalloidin staining (F,I) in WT Tg(myl7:Lifeact-GFP)mb21 (E?G), and smyd1bsa15678; Tg(myl7:Lifeact-GFP)mb21 transgenic mutant (H?J) embryos at 72 hpf. (G,J) are merged pictures of (E,F,H,I), respectively. Scale bars: 50 ?m.