
|
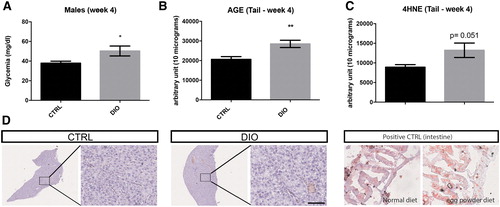
Fig. 2 DIO effects on hyperglycemia, AGE levels, 4-HNE levels, and liver steatosis. (A) Fasting blood glucose measurements at week 4 in CTRL and DIO-treated fish (n = 10–12). (B, C) Graphs showing dot-blot quantification of AGE and 4-HNE levels in the tail of CTRL and DIO fish at week 4 (n = 6). (D) Cryostat liver sections stained with Oil Red O in control fish showing no lipid accumulation, and consequently no liver steatosis in CTRL and DIO conditions at week 4 (n = 3). A positive control shows a stronger Oil Red O staining in the intestine of fish overfed 1 week with egg yolk from chicken compared with a fish receiving a normal diet. Bar graph: SEM. Student's t-test: *p < 0.05. **p < 0.01. Error bars correspond to SEM. Scale bar: 250 μm for lower magnification pictures, 50 μm for higher magnification ones. 4-HNE, 4-hydroxynonenal; AGE, advanced glycation end product; n, number of fish. Color images are available online.