
|
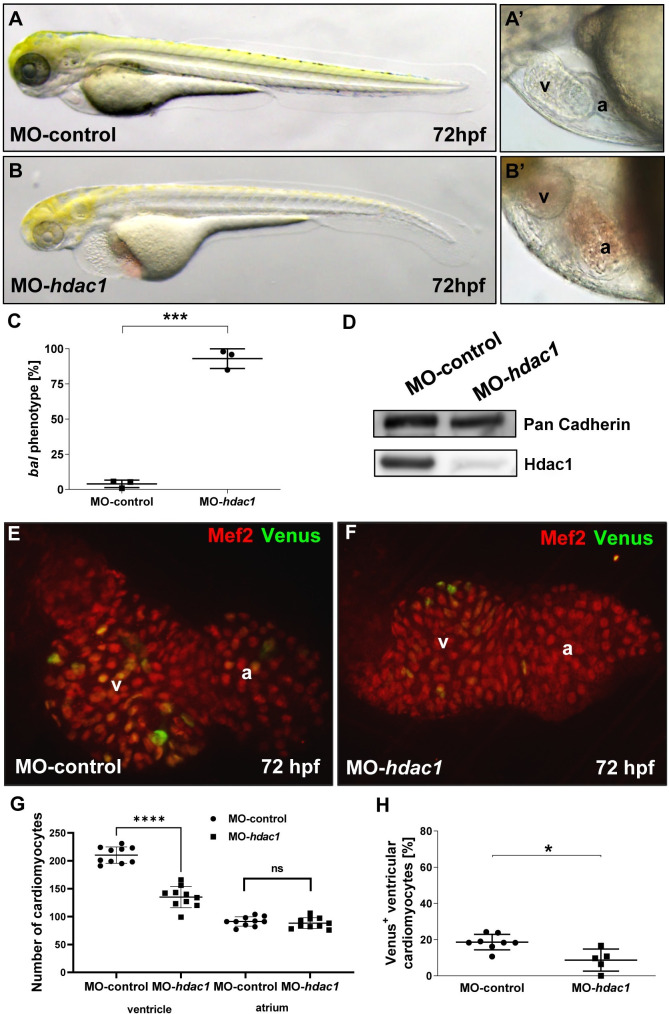
Fig 4
(A-B?) Lateral view of MO-control (A, A?) and MO-hdac1 (B, B?) at 72 hpf, injection of MO-hdac1 led to the bal heart phenotype (B?). (C) Statistical analysis of MO-hdac1 injection. MO-hdac1 injection highly significantly (p = 0.0001) induced the bal phenotype (245/264) compared to Ctrl-MO (10/248). Significance was calculated using two-tailed t-test, error bars show s.d., asterisks indicate significance. (D) Western blot analysis of lysates either from MO-hdac1 or MO-control injected embryos depicting reduced Hdac1 protein levels in the morphants. (E, F) IF staining for Mef2 (red) and Venus (green) on dissected hearts from embryos either injected with MO-hdac1 (E) or MO-control (F). (G, H) Statistical analysis of CM number (G) and cycling CMs (H) demonstrated a reduced CM number in the ventricle (MO-control 210.2 ▒ 14.68, MO-hdac1 135,0 ▒ 19.06, n = 10, p < 0.0001) but not in the atrium (MO-control 91.20 ▒ 8.38, MO-hdac1 88.2 ▒ 9.57, n = 10, p = 0.2079). Furthermore, a decreased cycling rate (p = 0.01) was revealed in MO-hdac1 injected embryos (H). Error bars indicate s.d.; *p < 0.05, ****p < 0.0001, ns, not significant.