
|
Figure 5
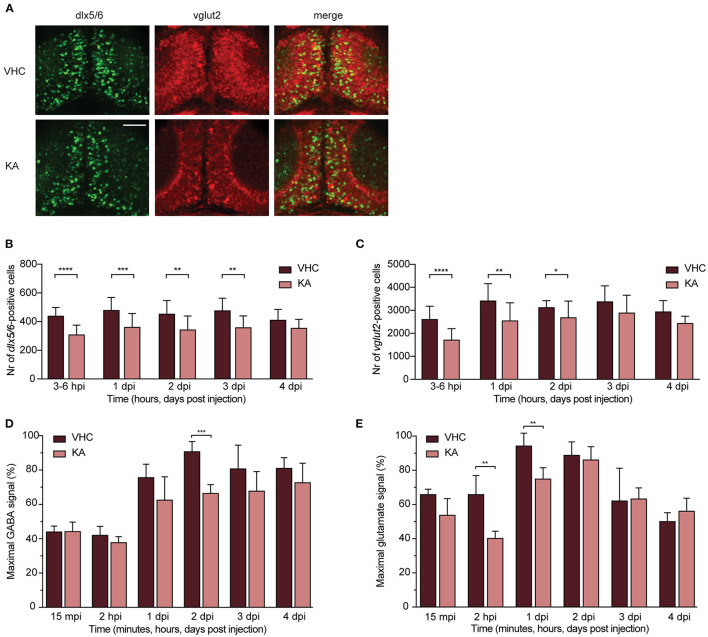
GABAergic and glutamatergic neuronal populations and neurotransmitters levels in kainic acid-injected larvae demonstrate a decrease. (A) Representative images of the GABAergic and glutamatergic neurons in transgenic reporter lines in 3?6 hpi VHC- and KA-injected larvae. Scale bar 50 ?m. (B) Statistically significant decrease in the number of dlx5/6-positive cells was observed from 3?6 hpi until 3 dpi (**p < 0.01, ***p < 0.001, ****p < 0.0001). (C) Statistically significant decreases in the number of vglut2-positive cells were observed from 3?6 hpi until 2 dpi (*p < 0.05, **p < 0.01, ****p < 0.0001). Data in (B,C) are presented as mean � s.d. Total number of larvae per condition: 3?6 hpi VHC n = 20, KA n = 15; 1 dpi VHC n = 17, KA n = 16; 2 dpi VHC n = 16, KA n = 18; 3dpi VHC n = 13, KA n = 14; 4 dpi VHC n = 6, KA n = 6. Statistical analysis was performed using unpaired t-test. LC-MS/MS analysis of GABA (D) and glutamate (E) levels in the larval brains at 15 mpi, 2 hpi and 1?4 dpi. (D) Statistical reduction in GABA levels between VHC- and KA-injected larvae was observed at 2 dpi (***p < 0.001), (E) while in glutamate levels at 2 hpi (**p < 0.01) and 1 dpi (**p < 0.01). Maximal signal (%) in (D,E) refers to the highest signal found among measured samples per each neurotransmitter. Data from four independent experiments are presented as mean � s.d. Statistical analysis was performed using unpaired t-test.