
|
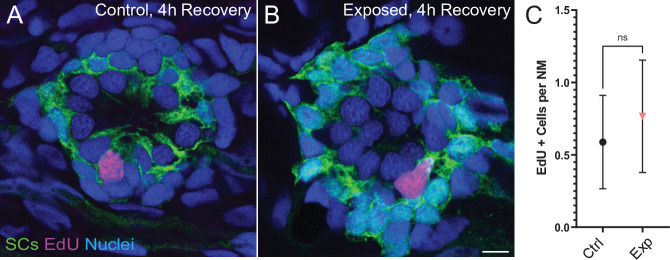
Figure 11.
(A,B) Representative cross-section images of EdU (magenta) labeling of proliferating neuromast cells. Fish were exposed to EdU for 4 hr following stimulus exposure. Supporting cells (SC) were expressing GFP. Scale bars: 5 �m (C) Average number of EdU + cells per neuromast were comparable in control and exposed larvae. Data were obtained from 33 to 34 neuromasts per condition over three trials (Two-way ANOVA. p = 0.4193). Bars represent 95% CI.
Neuromasts show no change in cell proliferation following mechanical overstimulation.