Figure 9
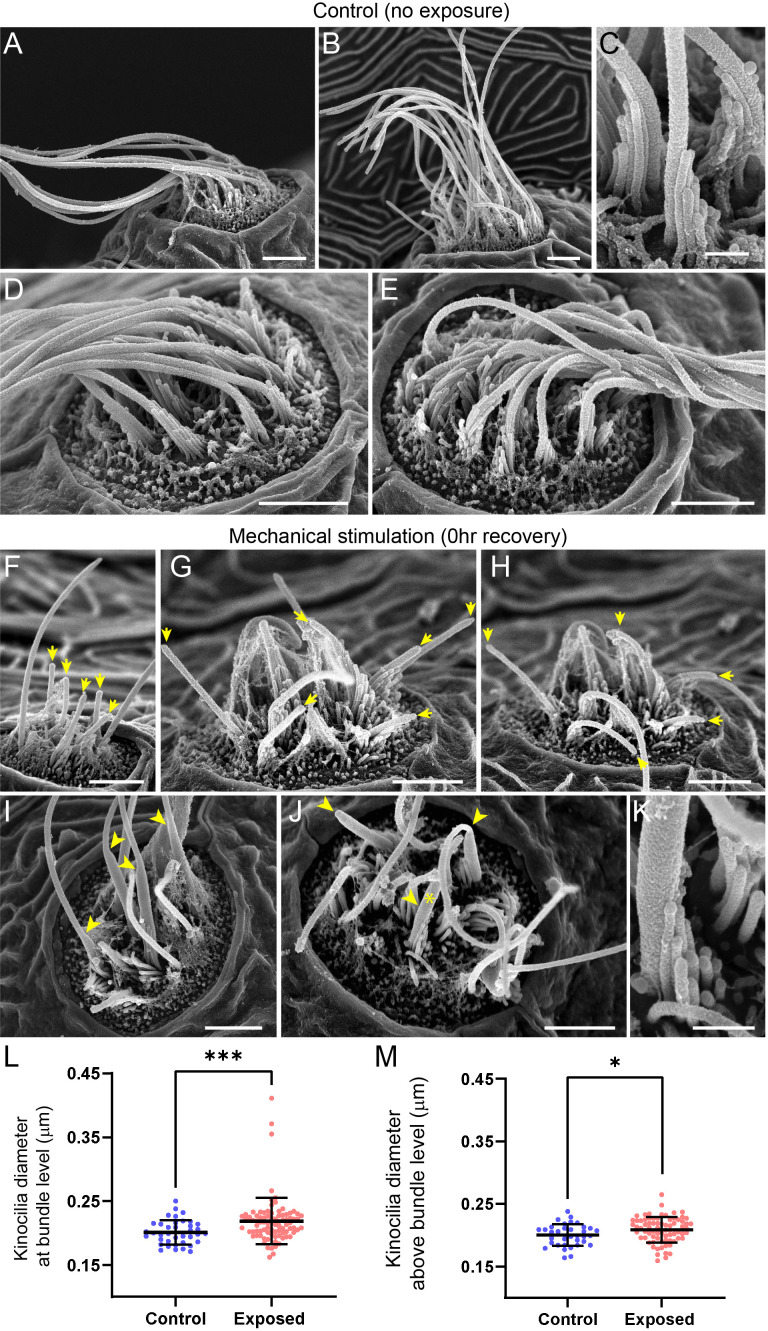
(A?E) Representative images of tail neuromasts of control fish larvae. Each hair cell carries a kinocilium, which is visibly thicker than its neighboring actin-filled, mechanosensitive stereocilia: see panel C featuring both structures at higher magnification (the kinocilium diameter is 220 nm, while stereocilia measured 90?110 nm). The kinocilia of control neuromasts are long (10?15 Ám) and bundled together, while the stereocilia bundles have an apparent staircase arrangement. (F?K) Representative images of damaged tail neuromasts immediately following noise exposure featuring short (F-H, yellow arrows), disorganized (G, H), and swollen (I-K, yellow arrowheads) kinocilia, and disorganized stereocilia. (K) Same stereocilia bundle as in J marked with an asterisk at higher magnification to highlight the difference in the diameter of the kinocilium (360 nm) and neighboring stereocilia (85?100 nm) for noise exposed hair cells, as compared to the control hair cells in C. Scale bars: A, B, D-J ? 2 Ám; C, K ? 500 nm. (L?M) Kinocilia diameter at bundle level (L; Mann Whitney test ***p = 0.0007) and 3?5 Ám above bundle level (M; Welch?s t test *p = 0.0243). Exposed NM data in L were not normally distributed (D'Agostino-Pearson test ****p < 0.0001). Error Bars = SD.
Scanning electron microscopy imaging of neuromasts following mechanical injury reveals disorganized hair-cell stereocilia bundles and damaged kinocilia.
Image
Figure Caption
Figure Data
Acknowledgments
This image is the copyrighted work of the attributed author or publisher, and
ZFIN has permission only to display this image to its users.
Additional permissions should be obtained from the applicable author or publisher of the image.
Full text @ Elife

