Figure 3
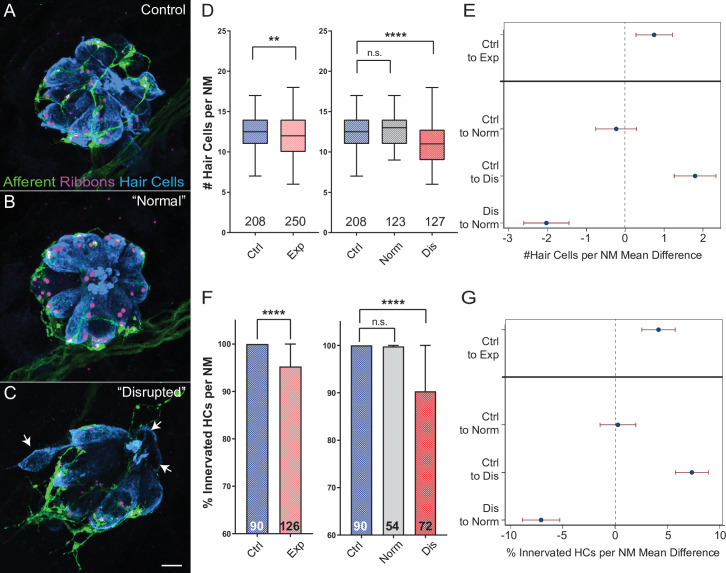
(A?C) Representative maximum intensity projection images of control (A) or exposed lateral line neuromasts with ?normal? (B) or ?disrupted? (C) morphology immediately following sustained strong wave exposure (0 hr). Synaptic ribbons (magenta; Ribeye b) and hair cells (blue; Parvalbumin) were immunolabled. Afferent neurons were expressing GFP. Scale bar: 5 Ám (D) Hair-cell number per neuromast immediately post exposure. A significant reduction in hair-cell number was observed (**Adj p = 0.0019) and was specific to ?disrupted? neuromasts (Adj p = 0.3859 normal, ****Adj p < 0.0001 disrupted). Pink box plot (Exp) represents pooled exposed neuromasts, while gray (Norm) and red (Dis) plots represent neuromasts parsed into normal and disrupted groups. Numbers beneath each plot indicate the number of neuromasts per group. Whiskers = min to max (E) Differences of least squares means in hair-cell number per neuromast between groups. Bars represent 95 % confidence interval (CI). (F) Percentage of neuromast hair cells innervated by afferent nerves. Numbers within each bar indicate the number of neuromasts per group. A significant portion of neuromast hair cells lacked afferent innervation following exposure (****Adj p < 0.0001). Hair cells lacking afferent innervation were specifically observed in disrupted neuromasts (Adj p = 0.7503 normal, ****Adj p < 0.0001 disrupted). (G) Differences of least squares means in % hair cells innervated per neuromast between groups. Bars represent 95% CI.
Hair-cell loss and de-innervation is specific to ?disrupted? neuromasts.
Image
Figure Caption
Figure Data
Acknowledgments
This image is the copyrighted work of the attributed author or publisher, and
ZFIN has permission only to display this image to its users.
Additional permissions should be obtained from the applicable author or publisher of the image.
Full text @ Elife

