
|
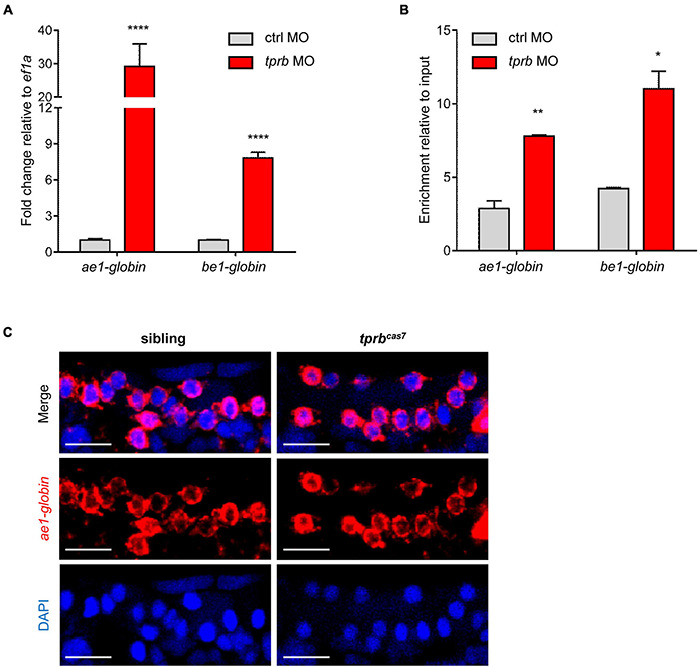
FIGURE 5
tprb inactivation enhances the transcriptional activity of erythroid genes. (A) Quantitative PCR results of ae1-globin, be1-globin, and alas2 in erythrocytes after sorting an equal number of gata1+ cells in control and tprb morphants at 3 dpf. (B) Quantitative qChIP results of the binding enrichment of RNA polymerase II (Pol II) in ae1-globin, be1-globin, and alas2 after sorting equal number of gata1+ cells. (C) Fluorescence in situ hybridization (FISH) results of ae1-globin mRNA localization in sibling and tprbcas7 mutants at 3 dpf. The nuclei were stained with DAPI (blue). Error bars represent SEM. N.S., not significant; *p < 0.05; **p < 0.01; ****p < 0.0001. Scale bars represent 20 μm.