
|
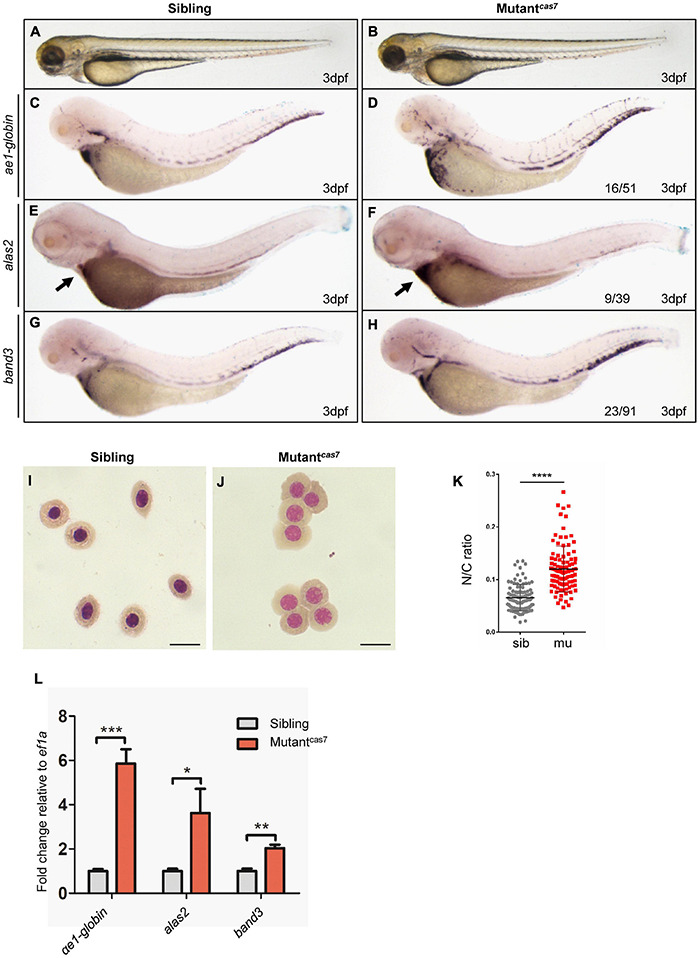
FIGURE 1
Erythroid maturation is disrupted in zebrafish mutantcas7. (A,B) Light microscope images of zebrafish wild-type (WT) sibling and mutantcas7 embryos at 3 dpf. (C?H) WISH analysis of ae1-globin (C,D), alas2 (E,F), and band3 (G,H) expression in sibling and mutantcas7 embryos at 3 dpf. After WISH and photographing, all embryos were extracted for genomic DNA and genotyped by sequencing, then the mutant percentage was evaluated. The number of embryos in a het-het incross clutch with the expression pattern is shown in the mutantcas7 column and corresponding percentages are listed inside each panel. Arrow in panel (E,F) indicates the alas2 staining in heart region. (I,J) Giemsa staining for erythrocytes at 4 dpf in sibling and mutantcas7. Relative to the number of orthochromatophilic erythroblasts, mutantcas7 displayed a marked increase in circulating polychromatophilic erythroblasts compared with sibling. Scale bars represent 10 ?m. (K) Statistical analysis of the nucleus-to-cytoplasm (N/C) ratio in sibling and mutantcas7. N = 100, error bars represent SEM. ****p ? 0.0001. (L) The relative expression of ?e1-globin, alas2, band3 in sibling and mutantcas7 embryos at 3 dpf. Error bars represent SEM. *p ? 0.05; **p ? 0.01; *** p ? 0.001.