
|
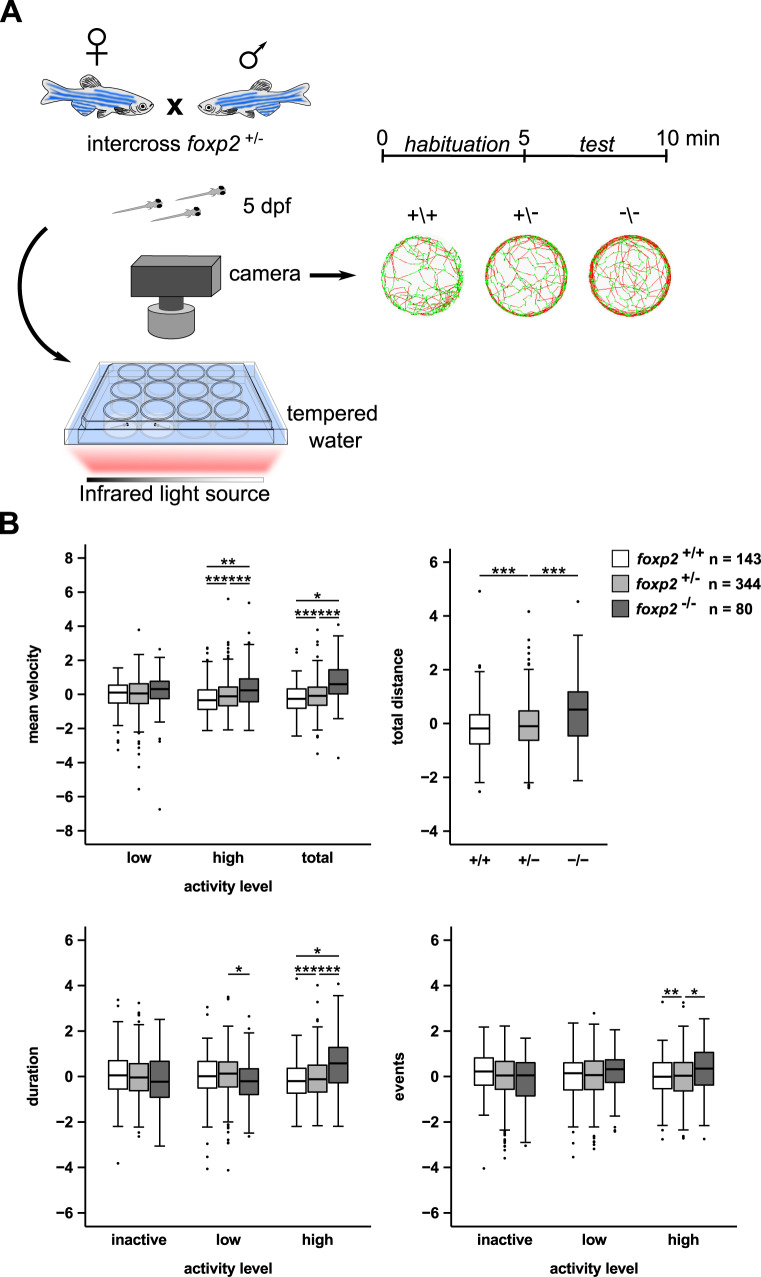
Fig. 2
A Crossing scheme and behavioural setup applied for locomotor tracking in 5 dpf old foxp2+/+, foxp2+/? and foxp2?/?. Circles illustrate representative swim tracks of individual fish with inactive (<0.2 cm/s, black), low activity (>0.2 cm/s and <1 cm/s, green) and high activity (>1 cm/s, red). B Locomotor activity of foxp2+/+ (white), foxp2+/? (light grey) and foxp2?/? (dark grey) analysed for mean velocity (top left) in low or high activity, or combined (total), total distance swum (top right), duration (bottom left) and events (bottom right) of inactivity, low and high activity. Raw data was standardised using z-score transformation. *P < 0.05, **P < 0.01, ***P < 0.001.