Fig. 8
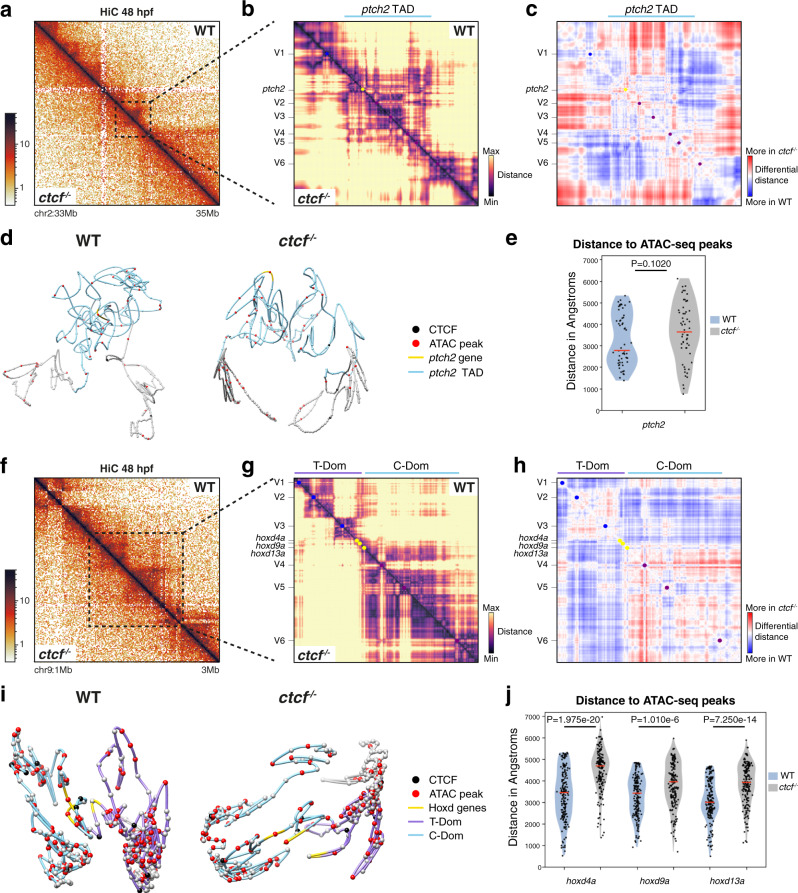
a HiC normalized contact maps at 10-kb resolution from WT and ctcf−/− zebrafish embryos at 48 hpf. A 2-Mb genomic region in chromosome 2 containing the ptch2 locus is plotted. b Virtual HiC matrices of the ptch2 locus from WT and ctcf−/− embryos showing distances based on UMI-4C data at 48 hpf. Viewpoints, including the ptch2 promoter, are shown on the left. The TAD containing ptch2 is highlighted in light blue. c Differential distances at the ptch2 locus from (b), between WT and ctcf−/− embryos. d Representative models of the 3D chromatin structure of the ptch2 locus in WT and ctcf−/− embryos. e Violin plots showing the distances between ATAC-seq peaks and ptch2 promoter within ptch2 TAD. f HiC normalized contact maps at 10-kb resolution from WT and ctcf−/− zebrafish embryos at 48 hpf. A 2-Mb genomic region in chromosome 9 containing the HoxD cluster is plotted. g Virtual HiC matrices of the HoxD locus from WT and ctcf−/− embryos showing distances based on UMI-4C data at 48 hpf. Viewpoints, including the hoxd4a, hoxd9a, and hoxd13a promoters, are shown on the left. The two TADs (T- and C-Dom) at the HoxD locus are highlighted in light blue. h Differential distances at the HoxD locus from g, between WT and ctcf−/− embryos. i Representative models of the 3D chromatin structure of the HoxD locus in WT and ctcf−/− embryos. j Violin plots showing the distances between ATAC-seq peaks in the HoxD locus and hoxd4a, hoxd9a, and hoxd13a promoters. For e and j, statistical significance was assessed using a two-sided Student’s t test. ***P < 0.001.

