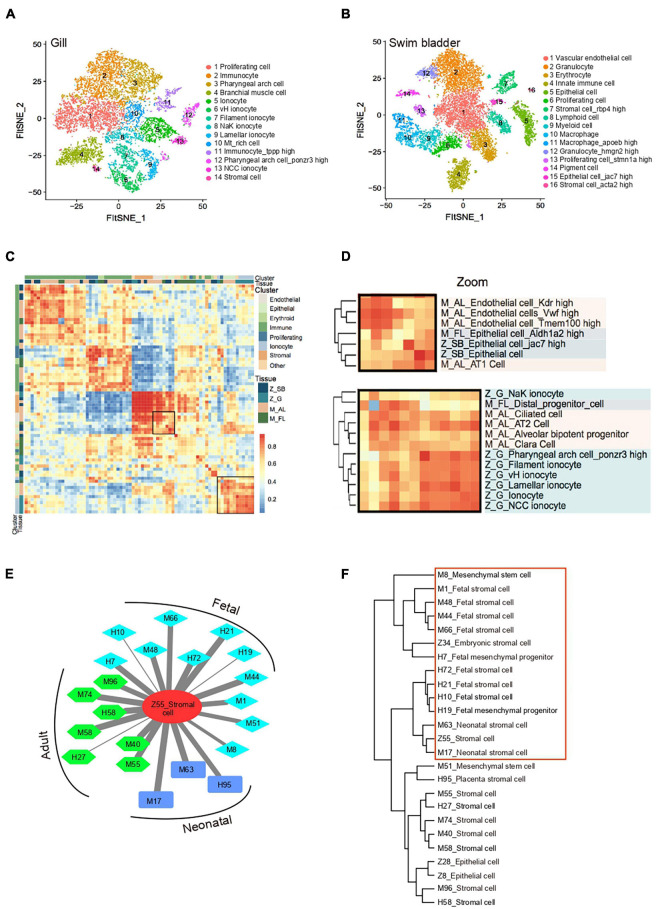
FIGURE 3 Cross-species analysis of cell-type similarity. (A) t-SNE map of zebrafish gill single-cell data. Cells are colored by cell-type cluster. (B) t-SNE map of zebrafish swim bladder single-cell data. Cells are colored by cell-type cluster. (C) Comparative transcriptome analysis of cell similarity between zebrafish gill, swim bladder and mouse lung. Red corresponds to a high correlation; blue and white correspond to low correlation. (D) Comparative transcriptome analysis of cell similarity between gill ionocytes and mouse lung epithelial cells. Zoom-in view of the region highlighted by a solid line in (C). Red corresponds to a high correlation; blue and white correspond to low correlation. Z_SB, zebrafish swim bladder; Z_G, zebrafish gill; M_AL, mouse adult lung; M_FL, mouse fetal lung. (E) A cell?cell correlation network between zebrafish stromal cell and human, mouse fetal, neonatal, adult stromal cells. Thick lines indicate high correlation; thin lines indicate low correlation. H, human; M, mouse; Z, zebrafish. (F) Hierarchical clustering identified correlation of human, mouse and zebrafish stromal cells.
Image
Figure Caption
Acknowledgments
This image is the copyrighted work of the attributed author or publisher, and
ZFIN has permission only to display this image to its users.
Additional permissions should be obtained from the applicable author or publisher of the image.
Full text @ Front Cell Dev Biol

