
Image
|
Figure Caption
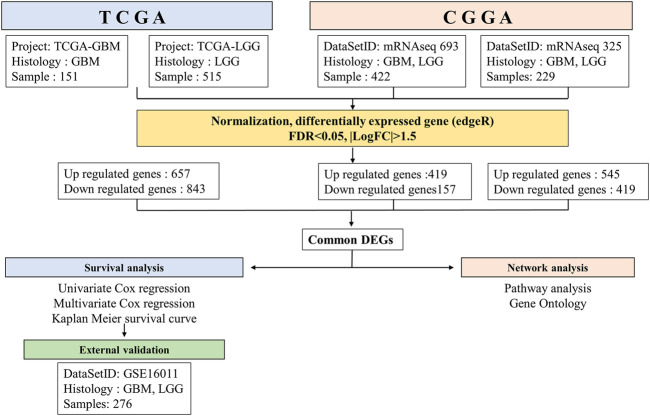
FIGURE 1 FIGURE 1. Workflow of gene expression analysis of RNA-seq datasets TCGA and CGGA. Each datasets were run through the pipeline individually, then selected common DEGs between GBM and LGG.
Figure Data
Acknowledgments
This image is the copyrighted work of the attributed author or publisher, and
ZFIN has permission only to display this image to its users.
Additional permissions should be obtained from the applicable author or publisher of the image.
Full text @ Front Genet