
|
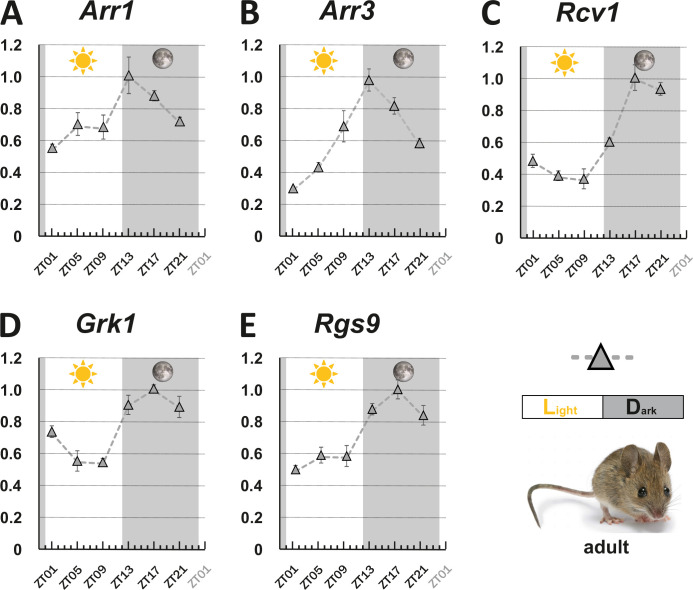
Figure 2
Transcript levels of indicated mouse genes (A-E) were measured using qRT-PCR on retinal tissue of 12-week-old wildtype mice. were measured using qRT-PCR on retinal tissue of 12-week-old wildtype mice. The time point of collection is indicated along the x-axis with ZT01 being the time point one hour after the light was turned on. Dark periods are indicated by the moon symbol and highlighted in gray, whereas the periods under regular light conditions are indicated by the sun symbol and shown in white. Data represents the mean � s.e.m. Statistical analysis was performed by ?RAIN? as previously described (Thaben and Westermark, 2014). Statistics information and the numbers of independent repeats are provided in Supplementary file 2. Metadata can be downloaded from DRYAD.
Circadian regulation of key visual transduction genes in nocturnal mice is reversed.