Figure 5
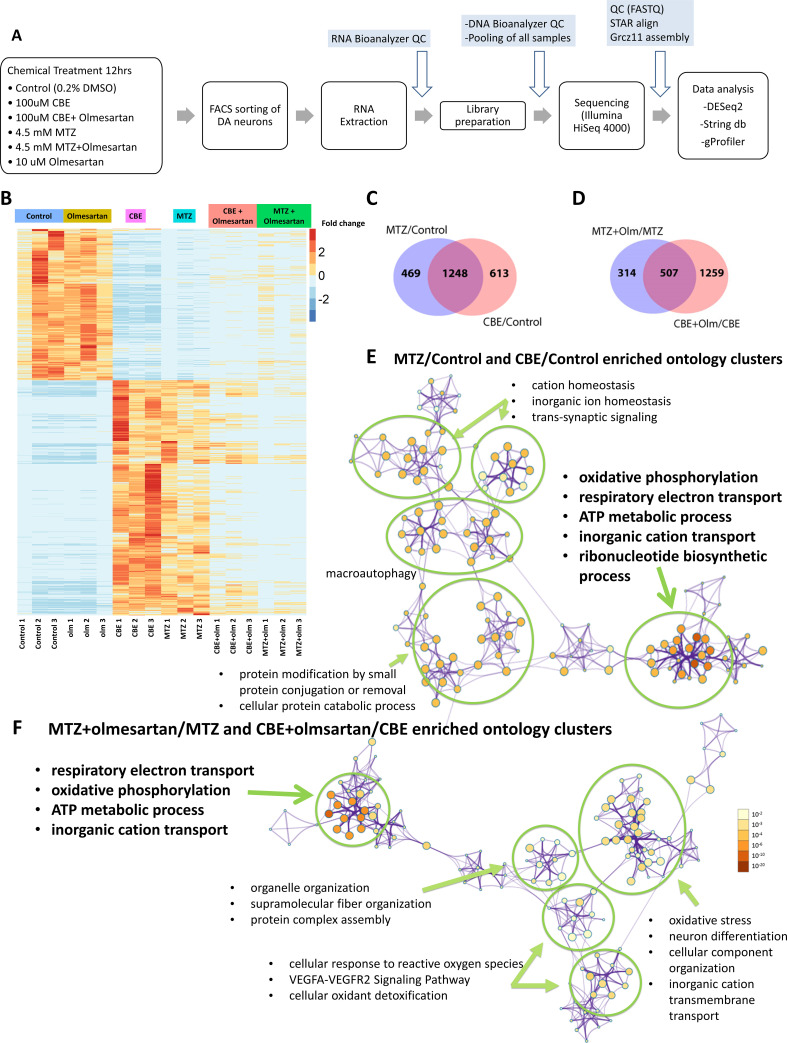
(A) A schematic showing the RNA-seq procedure of larval samples from chemical treatment to FACs, library preparation, and differential gene expression analysis. (B) A heatmap of clustering analysis comparing the differential gene expression in DMSO control, olmesartan, CBE, MTZ, MTZ+ olmesartan, and CBE+ olmesartan treatment groups. Gene counts were normalized and analyzed with the R program DESeq2 package. All samples are numbered 1, 2, and 3 to indicate biological replicates. (C?D) Venn diagrams showing the overlapping gene expression alterations between different conditions: MTZ/control and CBE/control (C) and MTZ+ Olmesartan/MTZ and CBE+ Olmesartan/CBE (D) (? = 0.05, FDR = 0.1, Wald test). (E?F) Metascape ontology clusters highlighting the top enriched GO terms for differential gene expression common between that of MTZ/Control and CBE/Control (E) and that of MTZ+ olmesartan/MTZ and CBE+ olmesartan/CBE (F). The colors of the nodes correspond to significant values. The size of the nodes is proportional to the number of input genes in the GO term. The most significant GO terms in both (E) and (F) include oxidative phosphorylation, respiratory electron transport, ATP metabolic process, and inorganic cation transport.
DA neuron-specific RNA-seq uncovers neurotoxic insult-induced alterations of mitochondrial pathway gene expression that is in part restored by the AGTR1 inhibitor olmesartan.
Image
Figure Caption
Figure Data
Acknowledgments
This image is the copyrighted work of the attributed author or publisher, and
ZFIN has permission only to display this image to its users.
Additional permissions should be obtained from the applicable author or publisher of the image.
Full text @ Elife

