
|
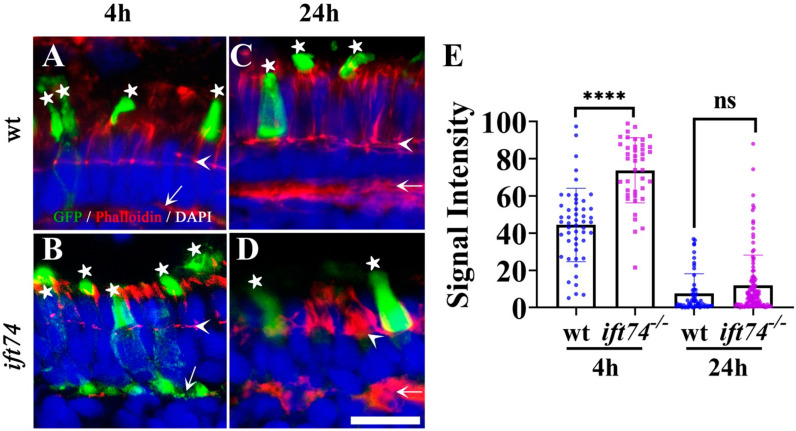
Figure 5
Opsin transport analysis in ift74 mutant. (A?D) Representative confocal images of transverse cryosections through the central retinae of wild-type and ift74 mutant larvae at 4 and 24 h after heat-shock induction. The subcellular distribution of the GFP-CT44 (green) was evaluated. Sections were counterstained with phalloidin (red) to visualize the outer limiting membrane and the outer plexiform layer. Cell nuclei were stained with DAPI in blue. (E) Relative GFP fluorescence intensity in the cell bodies measured between the outer limiting membrane and the outer plexiform layer. Asterisks indicate outer segments; arrowheads indicate the outer limiting membrane and arrows indicate the outer plexiform layer. Scale bar: 10 �m. **** p < 0.0001, ns, no significant.